Download
1 / 55
760 likes | 1.61k Views
Real Time PCR. Dr Abida Raza Senior Scientist Molecular Diagnostics & Research Laboratory Nuclear Medicines Oncology & Radiotherapy Institute. Outline. Conventional PCR Real Time PCR Chemistries of Real Time PCR How to develop the assays Use of Real Time PCR at NORI

E N D
Real Time PCR Dr Abida Raza Senior Scientist Molecular Diagnostics & Research Laboratory Nuclear Medicines Oncology & Radiotherapy Institute
Outline • Conventional PCR • Real Time PCR • Chemistries of Real Time PCR • How to develop the assays • Use of Real Time PCR at NORI • Quality Control issues • Application of Real Time PCR
Limitations of Conventional PCR • Assumptions on reaction consistency and uniformity • Narrow dynamic range • Long optimisation and set up times • Long run and analysis times • High levels of inherent inaccuracy and variation • PostPCR detection procedure • Low detection limit
Why Real Time PCR amplification Question from Yes or No to Howand/or How many? • Qualitative PCR to Quantitative PCR • Regulation of gene expression– • Disease diagnosis • Therapeutic monitoring • Contamination issues • Automation issues • Limitation of conventional PCR
Development of Real Time Analysis First reported in 1992 by Higuchi et al. Used ethidium bromide to intercalate into double stranded (ds) DNA and a thermal cycler modified with a cooled charged coupled device (CCD camera) attached. PCR cycle = dsDNA = dye = fluorescence Later changed to SYBR Green I as this has a much higher affinity for dsDNA rather than ssDNA compared to ethidium bromide.
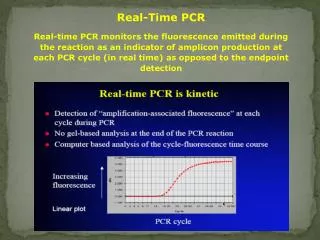
Real-Time PCR Real-time PCR monitors the fluorescence emitted during the reaction as an indicator of amplicon production at each PCR cycle (in real time) as opposed to the endpoint detection
Real-time PCR advantages * Not influenced by non-specific amplification * Amplification can be monitored real-time * No post-PCR processing of products (high throughput, low contamination risk) * Ultra-rapid cycling (30 minutes to 2 hours) * Wider dynamic range of up to 1010-fold * Requirement of 1000-fold less RNA than conventional assays (6 picogram = one diploid genome equivalent) * Detection is capable down to a two-fold change * Confirmation of specific amplification by melting curve analysis * Most specific, sensitive and reproducible
Real-time PCR disadvantages * Not ideal for multiplexing * Setting up requires high technical skill and support * High equipment cost
Real-time PCR Principles * Based on the detection and quantitation of a fluorescent reporter * The first significant increase in the amount of PCR product (CT - threshold cycle) correlates to the initial amount of target template
Real Time PCR Real Life Threshold Real-time PCR monitors the fluorescence emitted during the reaction as an indicator of amplicon production at each PCR cycle (in real time) as opposed to the endpoint detection Theoretical Amplification is exponential, but the exponential increase is limited Log Target DNA Real-Time PCR allows us to ‘see’ the exponential phase so we can calculate how much we started with. CT Cycle #
Real-Time and End Point End point assay bisects this way Real Time
Exponential growth phase = linear part in logarithmic graphic
Real Time PCR Chemistries Three general methods for the quantitative assays: 1. Hydrolysis probes (TaqMan, Beacons) 2. Hybridization probes, (Light Cycler) 3. DNA-binding agents (SYBR Green)
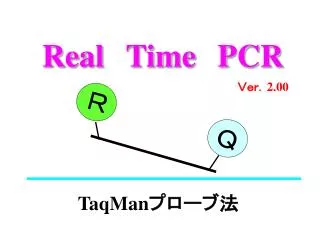
Hydrolysis probe technique The hydrolysis probe is conjugated with a quencher fluorochrome, which absorbs the fluorescence of the reporter fluorochrome as long as the probe is intact. Upon amplification of the target sequence, the hydrolysis probe is hydrolyzed by the Taq polymerase resultings in the separation of the reporter and quencher fluorochrome Consequently the fluorescence of the reporter fluorochrome becomes detectable. During each consecutive PCR cycle this fluorescence will further increase because of the progressive and exponential accumulation of free reporter fluorochromes.
Q 5’ 3’ R 5’ 3’ 3’ 3’ 3’ 3’ 3’ 3’ 5’ 5’ 5’ 5’ 5’ 5’ 5’ 5’ 5’ 5’ 5’ 5’ 3’ 3’ 3’ 3’ 3’ 3’ Taq Probe 5’ 3’ Q R 5’ 3’ 5’ 3’ 5’ 3’ dNTPs Primers Add Master Mix and Sample Thermal Stable DNA Polymerase Reaction Tube Denaturation l Annealing Taqman Technology
Q R 5’ 5’ 5’ 5’ 5’ 3’ 3’ 3’ 3’ 3’ 5’ 3’ 5’ R R Q 3’ Taq Taq Taq Taq Q R R R 5’ 3’ 3’ 5’ Q Q 3’ 5’ Taqman Technology 5’ 3’ Extension Step 1. Strand Displacement 2. Cleavage 3. Polymerization Complete l 4. Detection
Hybridization probes technique: • One probe is labelled with a donor fluorochrome at 3’ end and a second –adjacent- probe is labelled with an acceptor fluorochrome. When two fluorochromes are in close vicinity (1–5 nt apart), the emitted light of the donor fluorochrome will excite the acceptor fluorochrome (FRET) resulting in the emission of fluorescence, which can be detected during the annealing phase and first part of the extension phase of the PCR reaction. After each subsequent PCR cycle more hybridization probes can anneal, resulting in higher fluorescence signals.
SYBR Green technique • SYBR Green fluorescence is enormously increased upon binding to double-stranded DNA. During the extension phase, more and more SYBR Green I will bind to the PCR product, resulting in an increased fluorescence. Consequently, during each subsequent PCR cycle more fluorescence signal will be detected.
SYBR Green • (double-stranded DNA binding dye) • Emits a strong fluorescent signal upon binding to double-stranded DNA • Nonspecific binding is a disadvantage • Requires extensive optimization • Requires melting point curve determination • Longer amplicons create a stronger signal • May be multiplexed when coupled with melting curve analysis
When to Choose SYBR Green • Assays that do not require specificity of probe based assays. Detection of 1000s of molecules • General screening of transcripts prior to moving to probe based assays • When the PCR system is fully optimized -no primer dimers or non-specific amplicons, e.g. from genomic DNA
When Not to Choose SYBR Green • Allelic discrimination assays (not an absolute one) • Multiplex reactions (not an absolute one) • Amplification of rare transcripts • Low level pathogen detection
78% TaqMan probes 19% Molecular Beacons 15% FRET probes LUX fluorogenic primers 9% 9% MGB Eclipse probes 3% Other 2% Scorpion probes 0% 10% 20% 30% 40% 50% 60% 70% 80%
Design the experiment: What you need? I. Assay Development A. Sequence selection B. Primer & probe selection C. Quencher dye and internal reference D. Assay validation II. Assay Setup A. One- or two-step PCR B. Thermocycler settings III. Data Analysis A. Baseline and threshold settings B. Standard curves C. Inter- vs intra-assay variability D. Sample normalization
One-Step or Two-Step PCR • One-step real-time RT-PCR performs reverse transcription and PCR in a single buffer system and in one tube • Two-step RT-PCR performs reverse transcription and PCR in different tubes
Selection of method Kits Components • Greater flexibility • Less expensive • Have own system • Too little reagent volume in kits • Convenience • Guaranteed optimized system • Cost effective
Selection of Instrument Performance Parameters Product Specifications • Sensitivity • Linear dynamic range • Time-to-results • Throughput • Excitation Source • Software • Block/sample capacity • Size • User interface
The majority of researchers prefer using kits rather than individual components for real-time PCR amplification. • TaqMan probes are the most popular choice for users of fluorescent probes/primers. • Software, sensitivity and user interface are the most important features of real-time PCR instrumentation.
Commonly Used Real-Time PCR Instrumentation 26% ABI PRISM 7700 System 18% ABI PRISM 7000 LightCycler System 16% iCycler iQ System 12% ABI PRISM 7900 System 9% 7% GeneAmp 5700 System 3% Smart Cycler System DNA Engine Opticon System 2% 2% Rotor-Gene 2% Mx4000 Multiplex System 1% Other 0% 5% 10% 15% 20% 25% 30%
What you want to do? • Absolute Quantitation • Standard Curve • Standards must be accurately quantified • Best for viral load determination like Hep C, Hep B • Relative Quantitation • Standard Curve • Standards are serial dilutions of calibrator template • Best for gene expression studies, like Her2 neu gene expression • Comparative Quantitation • Mathematical Determination • Calibrator sample used as 1x standard • Best used when particular ratios are expected or to verify the trends
Services offered by NORI Hepatitis C and Hepatitis B Qualitative Tests, negative/positive Quantitative Testing—Viral load HCV genotyping HBV genotyping
HCV Infection- An Example Diagnostic testing—Yes/No—PCR Treatment selection/follow up of progression—Pathogen concentration? • Already available/in use techniques: • Biological markers • Virological markers HCV Molecular Diagnostics! Why ?
HCV Molecular Diagnostics Acute Hep C Detection of HCV-RNA (50 HCV RNA IU/ml or less) without anti-HCV------strong indicative Chronic Hep C Both anti-HCV & HCV-RNA (50 HCV RNA IU/ml or less) Anti-HCV positive, but HCV RNA is undetectable for at least two occasions 6 months apart, it is very difficult to distinguish patients who still harbor antibodies after spontaneously resolving HCV infection in the past from patients with false-positive reactivity
Molecular Diagnostics helps in treatment decision & schedule Genotype 1---only 40-45% chance of responding to therapy—48 week of treatment---1.0-1.4 g ribavirin qd Genotyping 2 or 3---70-80% response--24 weeks of therapy---0.8g ribavirin qd Baseline HCV RNA quantification must be performed in genotype 1 infected patients, it serves as reference value to assess virologic response at week 4,12 and 24. Same is the case for genotype 4, 5 and 6.
Assessment of virological response to therapy If level is undetectable at week 4, Patient is a rapid virological responder, more chance of SVR If HCV RNA is undetectable at week 12, patient is regarded as early virological responder If 2 log drop is observed at week 12 patient is called partial early virological responder, chances of SVR decreased. If HCV RNA is detectable at week 24, patient is called non responder, may be asked for prolong treatment for 48 week If HCV RNA is negative at week 24, but positive after 24 week of completion of therapy, patient is a relapse case.
Clinical Oncology Her2/neu detection Amplification/strong expression can be seen in 20 to 30% invasive breast carcinomas Marker of adverse clinical outcome Predictive marker for reduced response to therapy & hormonal treatment Positive Her-2 status predicts response to Herceptin
Real Time PCR based Diagnostics 1. Blood Sample Collection (Plasma stored at -20°C) 2. RNA/DNA Extraction using King Fisher/Manual 5. Analysis of run using Corbett Research 6000TM Software 4.Setting up of Rotor Gene for detection 3. Master Mix Prep
(Cy5,FAM/Sybr,JOE,ROX) Viral load Expressed as IU/ml Low: less than 8x10⁵ IU/ml High: more than 8x10⁵ IU/ml
HCV • Viral Load Calculations of Replica Ct with Standard Deviation
Her2/neu Quantitative gene expression data is normalized to theexpression levels of control or so-called "housekeeping"gene GAPDH Glyceraldehyde-3-phosphate dehydrogenase. Result is taken as ratio of Her2/neu to GAPDH
Quality Control Issues • Instrument sensitivity single copy • Technology selection Taqman/Dual labeled probe/FRET • Method/kit sensitivity 172 IU/ml • 50 IU/ml (95% confidence interval) • 4 controls in each run--- • Reproducibility/repeatability/precision Random use of Negative and positive samples in random runs, intra run STD variation • Accuracy= No. of true positives+No. of true negatives/No. of true positives+falsepositives+false negatives+true negatives, must be 100% for dual labeled probe. • Sensitivity and specificity are calculated statistically by using binary classification test. Sensitivity= No. of true Positives/No. of true Positives+ No. of false Negatives Specificity= No. of true Negatives/No. of true Negatives+ No. of false Positives
Reproducibility/repeatability/precision Random use of Negative and positive samples in random runs, intra run STD variation
Accuracy • = No. of true positives +No. of true negatives/No. of true positives +false positives + false negatives + true negatives • must be 100% for Dual Labeled Probe.
Accuracy and Precision calculations Accuracy (inter run): inter standards 99.98 ± 0.015% Precision (intra runs):
Use of Internal control Quantitation data for Cycling A.FAM/Sybr HCV 629 as negative control STD Patient Neg. C Quantitation data for Cycling A.JOE HCV-676 & HCV-629 Neg. C Patient STD
Parameters to be kept in mind during ANALYSIS • Slope correction • Dynamic tube settings • Intra standard %age variance calculated automatically within run (Accuracy) • Intra run %age variance (Precision) calculated manually • Threshold settings, calculated manually keeping in view the actual Well Fitted Data. • Threshold cycles: Statistically significant fluorescence as compared to back ground • Elimination of early cycles, Difference Of Handling
R2 value of standard curve, must be Between 1 to 0.9 • r value of the run, which is a measure of how well the Actual Data Fit To The Standard Curve. r = (explained variation/total variation) • Slope value of the run must be within a certain range/value (-3.76 to -3.04) • Efficiency of the reaction Efficiency (h) = [10(-1/slope) ] – 1 • Most important calculations or a measurement can be accurate but not precise, precise but not accurate, neither, or both. A measurement system or computational method is called valid if it is Both Accurate And Precise.