Download
1 / 26
260 likes | 389 Views
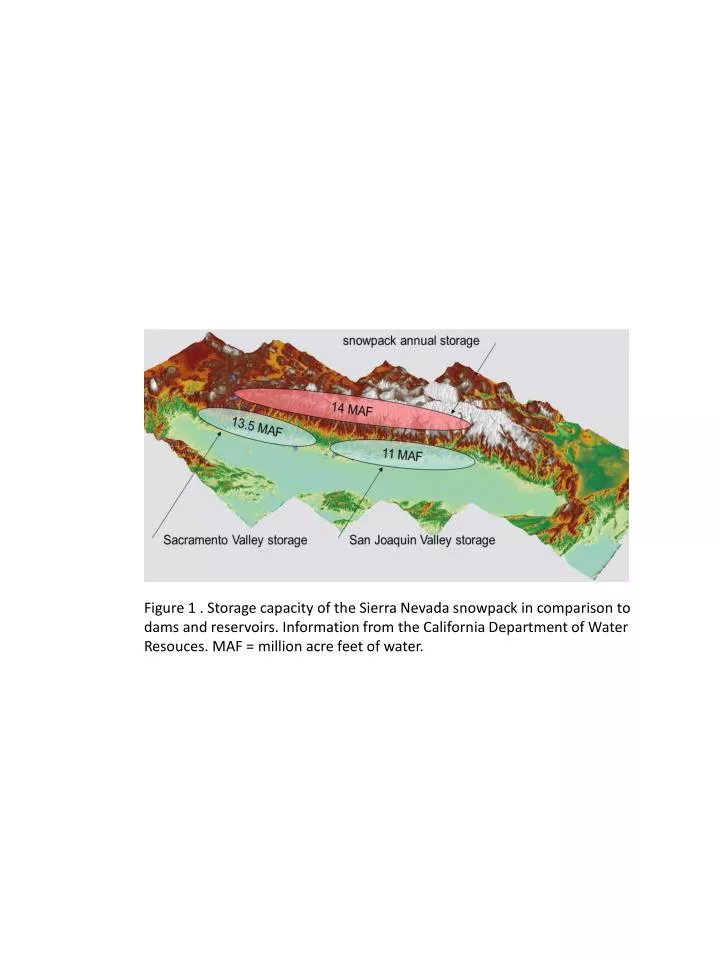
Figure 1 . Storage capacity of the Sierra Nevada snowpack in comparison to dams and reservoirs. Information from the California Department of Water Resouces . MAF = million acre feet of water.

E N D
Figure 1 . Storage capacity of the Sierra Nevada snowpack in comparison to dams and reservoirs. Information from the California Department of Water Resouces. MAF = million acre feet of water.
Figure 2. Average precipitation and snow water equivalent (SWE) in the Sierra Nevada (from Bales et al., 2006). Precipitation data are for 1961 to 1990 and SWE data for 1951 to 2003.
Figure 3. Predicted changes in evapotranspiration for forested watersheds in the Sierra Nevada as a function of precipitation inputs and reductions in forest cover. Predictions are based on Zhang et al. 2001 (eq.8). The range of annual precipitation represent the reported gradient observed in the Sierra Nevada (Kattelman et al. 1983). 90% canopy cover represents an estimate of the maximum tree cover observed in a Sierran headwater watershed. 60% and 30% represent modest and intense vegetation manipulations
90 120 150 180 210 240 270 300 330 360 Water year day, 2005 Figure 4. Snow covered area (SCA) for water year 2005, an above-average snow year, for the Kings River basin. Data are lumped by 300-m elevation band. Fitted curves show patterns of snowmelt, with each successively higher elevation band melting out 2-4 weeks later than the next lower band (from Bales et al., 2010). Data based on fractional SCA mapping of MODIS data, and are corrected for snow under canopy.
O N D J F M A M J J A S Figure 5. Water year basin-average precipitation and discharge for one mixed-conifer, headwater catchment, elevation 1750-2000 m (from Bales et al., submitted).
Figure 6. Water yield for 8 headwater catchments ranging in size frm49 to 228 ha. for 4 water years. Lower catchments are mixed rain-snow, and higher-elevation catchments are snow dominated. All are in mixed-conifer forest (from Hunsaker et al., submitted).
Figure 7. Simplified forest energy balance. 1 = insolation (incoming shortwave radiation); 2 = reflection (of shortwave radiation due to albedo or reflectivity of vegetation, soil, and water surfaces); 3 = longwave radiation emitted by the Earth; 4 = longwave radiation reflected back to Earth from greenhouse gases including water vapor and CO2; 1-2-3 + 4 = net radiation. Radiation inputs into the forest may be transformed into sensible heat (5), resulting in warming of the environment, latent heat (6, the energy consumed in evapotranspiration), or metabolic heat (7, the energy stored in biochemical reactions). Although it is not shown, understory vegetation also contributes to these processes. (Ref: NRC, 2008).
Figure 8. Simplified forest water balance. runoff, or infiltration excess (Horton) overland flow; 5 = subsurface flow, or lateral subsurface flow; 6 = groundwater recharge; 7 = groundwater flow; 8 = saturation excess overland flow; 9 = discharge or streamflow; 10 = evapotranspiration; 11 = precipitation intensity; 12 = peak flow or peak discharge. Although it is not shown, understory vegetation also contributes to these processes. (Ref: NRC, 2008).
Figure 9. Time series of observed and simulated SWE at paired forest and clearing sites. Aptal is in Switzerland, 1185-1220 m, 47o 3’ N, 3-11o slope and 25-m spruce and fir in forested plot. Fraser is in Colorado, 2820 m, 39o 53’ N, 17oslope and ~27-m spruce and fir in the forested plot. Adapted from Ellis et al. (2010).
D J F M A M Figure 10. Snow depth relative to canopy, based on 27 continuous sensors at Southern Sierra Critical Zone Observatory, water year 2009. Adapted from Bales et al. (in press).
From soil storage Figure 11. Characteristics for a plot in a lower montane coniferous forest, Yosemite National Park, 1582 m elevation. Temperature minima and maxima are mostly above freezing. Water supply (rain plus snowmelt, open circles) exceeds evaporative demand (potential evapotranspiration or PET, closed circles) from October to early May. Values calculated from PRISM climatological means (1971–2000). From Lutz et al. (2010) Assumed soil-water capacity is 8 cm, annual precipitation 107 cm, annual water deficit 28 cm and annual actual ET 41 cm.
Precipitation + snowmelt From subsurface storage ET Figure 12. Water supply and ET for CZO catchment, 1900 m mean elevation, Sierra National Forest. Area below the ET line but above the precipitation + snowmelt line form subsurface storage. Adapted from Bales et al. (submitted).
Figure 13. Visualization of wall-and-step forest treatments, suggested as the best technique for maximizing snow accumulation and delaying melt (from Anderson 1963).
N Onion Cr North Fork American R 5 km Middle Fork American R Rice Cr Little Bald Mt Cr Dolly Cr Bear Trap Cr French Meadows Cottonwood Cr Hell Hole Frazier Cr Ellis Cr Rubicon R Figure 14. Locations of the potential study watersheds in the headwaters of the North and Middle Forks of the American River. Also shown is the watershed boundary of the each fork and two high elevation reservoirs, French Meadows and Hell Hole. Elevations in this map peak at 2750-m along the crest of the Sierra in the east, with the major rivers draining towards the west, exiting the region shown at about 700-m, flowing down towards the Sacramento Delta.
N Onion Cr North Fork American R 5 km Middle Fork American R Rice Cr Little Bald Mt Cr Dolly Cr Bear Trap Cr French Meadows Cottonwood Cr Frazier Cr Hell Hole Ellis Cr Rubicon R Figure 15. Geologic features in the study region. Andesites(volcanic origin) from the Cenzoic period overlay a mix of older sections of granitic and metamorphic bedrock, with some glacial deposits at the bottom of higher elevation valleys. The volcanic period at the end of the Eocene created much of the landscape and soils present today, with glacial influences above 1450-m.
N Onion Cr North Fork American R 5 km Middle Fork American R Rice Cr Granite Chief Wilderness Little Bald Mt Cr Dolly Cr French Meadows Bear Trap Cr Cottonwood Cr Hell Hole Frazier Cr Ellis Cr Rubicon R Figure 16. Land ownership in the American River headwaters. Privately held lands of interest around potential study watersheds are display.
Onion Cr N North Fork American R 5 km Middle Fork American R Rice Cr Granite Chief Wilderness Little Bald Mt Cr Dolly Cr French Meadows Bear Trap Cr Cottonwood Cr Hell Hole Frazier Cr Ellis Cr Rubicon R Figure 17. General vegetation map of study area.
Onion Cr N North Fork American R 5 km Middle Fork American R Rice Cr Granite Chief Wilderness Little Bald Mt Cr Dolly Cr Bear Trap Cr French Meadows Cottonwood Cr Hell Hole Frazier Cr Ellis Cr Rubicon R Figure 18. Soils in the lower elevation (<1830-m) of the displayed region are of the Hurlbut-Deadwood-Putt association, with gravelly loam to cobbly sandy loam texture and can be shallow to moderately deep with moderate water holding capacity. In the higher elevations (>1675-m) the Tallac-Smokey-Meiss association is predominant, having soils that can range from shallow to deep with sandy loam to gravelly loam texture with low water holding capacity.
N Onion Cr North Fork American R 5 km Middle Fork American R Rice Cr Granite Chief Wilderness Little Bald Mt Cr Dolly Cr French Meadows Bear Trap Cr Cottonwood Cr Hell Hole Frazier Cr Ellis Cr Rubicon R Figure 19. Soils in the lower elevation (<1830-m) of the displayed region are of the Hurlbutt-Deadwood-Putt association, with gravelly loam to cobbly sandy loam texture and can be shallow to moderately deep with moderate water holding capacity. In the higher elevations (>1675-m) the Tallac-Smokey-Meiss association is predominant, having soils that can range from shallow to deep with sandy loam to gravelly loam texture with low water holding capacity. Soils on this map are organized by Map Unit Symbol, and are too numerous to display here. A legend and index of soil names within the potential study catchments are included as an appendix.
N Onion Cr North Fork American R 5 km Middle Fork American R Rice Cr Granite Chief Wilderness Little Bald Mt Cr Dolly Cr French Meadows Bear Trap Cr Cottonwood Cr Hell Hole Frazier Cr Ellis Cr Rubicon R Figure 20. Soils in the candidate catchments overlain on geology map. See Figure 15 for index of geologic features. A legend and index of soil names within the potential study catchments are included as an appendix.
Figure 21. Onion Creek a) topography, b) geology, c) soils, d) vegetation class, e) vegetation density, and f) land ownership.
Figure 22. Dolly and Rice Creeks a) topography, b) geology, c) soils, d) vegetation class, e) vegetation density, and f) land ownership.
Figure 23. Distribution of vegetation density for Onion, Rice and Dolly Creek catchments.
Appendix 1. Legend of soils by Map Unit Symbol for Figure 19. These are only soils within the potential study catchments and do not encompass the entire region.