Download
1 / 28
280 likes | 465 Views
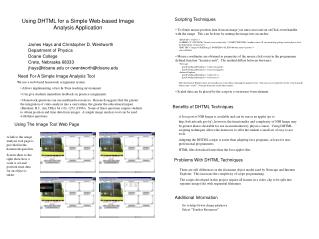
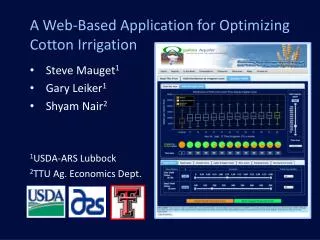
A Web-Based Application for Optimizing Cotton Irrigation. Steve Mauget 1 Gary Leiker 1 Shyam Nair 2 1 USDA -ARS Lubbock 2 TTU Ag. Economics Dept. Cotton Yield and Applied Water Relationships under Drip Irrigation 1988-1999 Surface Drip Field Trials. Figure 2 Wanjura et al., (2002).

E N D
A Web-Based Application for Optimizing Cotton Irrigation Steve Mauget1 Gary Leiker1 Shyam Nair2 1USDA-ARS Lubbock 2TTU Ag. Economics Dept.
Cotton Yield and Applied Water Relationships under Drip Irrigation1988-1999 Surface Drip Field Trials Figure 2 Wanjura et al., (2002)
Profit Based Irrigation in Agriculture(Nicholas Kenny, Texas AgriLife) https://watermgmt.tamu.edu/videos.jsp ΔY ΔY ΔY ΔY ΔW ΔW ΔW ΔW
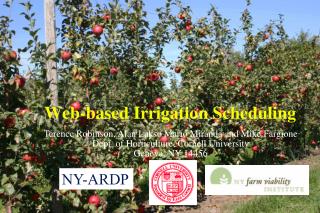
JavaScript Web Client OAP Server DSSAT Modelled Lint Yield Database Center Pivot Profit Effects ( Combined Dryland& Irrigated) Dryland & Irrigated Profit Per Acre Profit Equation User Defined Price & Cost Conditions User Defined Well Capacity & Center Pivot Area
DSSAT Crop Model:Weather & Crop ET Data • Four weather stations, 30 years • (1975-2004) data per station.
DSSAT Lint Yield Modelling May-Sept. Rainfall + Total Irrigation May-Sept. Cotton Crop ET 100.0 X • For each station & each year conduct DSSAT simulations under drylandconditions and 12 irrigation levels • (11.0”,12.0”,...,22.0”). Wanjura et al., (2002) Maximum 75th Percentile Median 25th Percentile • Minimum 58 cm = 22.83” 0.0 11.0 12.0 13.0 14.0 15.0 16.0 17.0 18.0 19.0 20.0 21.0 22.0 (Dryland) May-September Total Irrigation (Inches)
DSSAT Cotton Production Simulations • Planting Date: 15 May • Harvest date: 31 October • 0% abandonment rate... Every modelling year produced a crop • Dryland: • Fixed N application rate = 30 lb/acre. • 120Modelled Yields. • Irrigated: • Fixed N application rate = 125 lb/acre via fertigation. • Irrigation events every 5 days, May 16-Sept. 17. • 120 Modelled Yields for each irrigation level. • 1440 (=12X120) total irrigated yields.
DSSAT Yield Modelling DSSAT Modeled Yields vs. Total Water DSSAT Center Pivot Irrigated Pounds (Lint) per Acre DSSAT Dryland Total May-September Irrigation + Rainfall (Inches) Field Study Lint Yields vs. Total Water TAWC Center Pivot Irrigated Pounds (Lint) per Acre AG-CARES Dryland Total May-September Irrigation + Rainfall (Inches)
Modelled Lint Yield Adjustment 308 lb/acre DSSAT Center Pivot Irrigated Pounds (Lint) per Acre DSSAT Dryland TAWC Center Pivot Irrigated AG-CARES Dryland Total May-September Irrigation + Rainfall (Inches) Lint Yield Distributions by Irrigation Level Maximum 75% Pounds (Lint) per Acre Median 25% Minimum - 385.2 lbs/acre = NASS Dist. 12 Dryland Avg. Yield (2001-2010) Dry Land 11.0 12.0 13.0 14.0 15.0 16.0 17.0 18.0 19.0 20.0 21.0 22.0 TI = Total May-September Irrigation (Inches)
Wanjura et al., (2002) Figure 4 LY = 954 + 11.4*Irrigation Lint Yield Distributions by Irrigation Level Pounds per Acre Dry Land 11.0 12.0 13.0 14.0 15.0 16.0 17.0 18.0 19.0 20.0 21.0 22.0 TI = Total May-September Irrigation (Inches)
NASS District 12 Average Irrigated andDrylandLint Yields(1972-2010) 1988-1999 2004-2010 Irrigated Pounds per Acre Dryland
Lint Yield Database Lint Yield Distributions by Irrigation Level Pounds per Acre - 385.2 lbs/acre = NASS Dist. 12 Dryland Avg. Yield (2001-2010) Dry Land 11.0 12.0 13.0 14.0 15.0 16.0 17.0 18.0 19.0 20.0 21.0 22.0 TI = Total May-September Irrigation (Inches)
Profit per Acre (π) Calculation π = Lint Yield Income + Seed Yield Income – Production Costs π = (Ylint x Plint ) + (Yseed x Pseed ) - CProduction Cotton seed yield (ton acre -1) Cotton seed sales price ($ ton-1) Production costs ($ acre-1) Cotton lint sales price ($ lb-1) Cotton lint yield per acre (lb acre-1)
Production Costs CProduction= Cs + Cn + Ccust + Cgin + Cins + Clabor + Cfuel + Crep + Cint + Cfexp + Cpump Where (all units in $ acre-1), Cs = Seed Costs Cn = Nitrogen Costs Ccust = Custom Costs Cins = Insurance Costs Clabor = Labor Costs Cfuel = Fuel Costs Crep = Repair Costs Cint = Interest Costs Cfexp = Fixed Expense Costs Cpump= Pumping Costs Cgin= Ginning, Bagging & Classing Costs
Cpump = Cacre-inch x TI Pumping Costs: Total Pumping Head = Pump Lift + Elevation Head + Friction & Pressure Head
I. Profit Response Per Acre to IncreasingTotal Irrigation (TI) π = (Ylint x Plint ) + (Yseedx Pseed ) - CProduction Here, seed yield is a multiple of lint yield, Irrigation Maintenence Charge per Acre-Inch So,
II. Profit Response Per Acre to IncreasingTotal Irrigation If yield response to increasing irrigation is linear, i.e., Pounds (Lint) per Acre Then the profit response to increasing irrigation is also linear, Dry Land 11.0 12.0 13.0 14.0 15.0 16.0 17.0 18.0 19.0 20.0 21.0 22.0 TI = Total May-September Irrigation (Inches) = (Yield Income Effect) - (Pumping Cost Effect)
III. Profit Response (Per Acre) to Increasing Total Irrigation Lint Price = $ 0.75 / lb Lint Price = $ 0.50 / lb Pump Lift 100 ft 300 ft 500 ft Dry- 11 12 13 14 15 16 17 18 19 20 21 22 land Dry- 11 12 13 14 15 16 17 18 19 20 21 22 land Dry- 11 12 13 14 15 16 17 18 19 20 21 22 land Dry- 11 12 13 14 15 16 17 18 19 20 21 22 land Dry- 11 12 13 14 15 16 17 18 19 20 21 22 land Dry- 11 12 13 14 15 16 17 18 19 20 21 22 land Total May-September Irrigation (Inches) Total May-September Irrigation (Inches) Total May-September Irrigation (Inches) Total May-September Irrigation (Inches) Total May-September Irrigation (Inches) Total May-September Irrigation (Inches) $/acre 100 $/acre 100 $/acre 100 $/acre 100 $/acre 100 $/acre 100
I.Profit over Center Pivot Area Calculation Center Pivot Area = 126 or 503 acres Profit per irrigated acre Profit per dryland acre Number of irrigated acres Number of dryland acres
II. Center Pivot Profit Calculation Irrigation Period (May 16-Sept. 17=125 Days) H2O Volume Well Flow Rate Total Irrigation = TI = 11.0”,12,0”,....22.0” (126 or 503 acres )
III. Center Pivot Profit Calculation Center Pivot Area = 503 Acres
http://www.ogallala.ars.usda.govTools Cotton Irrigation Tool
http://www.ogallala.ars.usda.govTools Ogallala Agro-Climate Tool