Download
1 / 23
230 likes | 362 Views
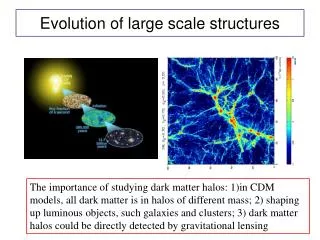
Progress towards large-scale analyses of mussel body temperatures. K. Allison Smith University of South Carolina 2007 NASA Earth Systems Science Fellow. Kearney and Porter 2009. Helmuth 1998, 1999. Helmuth 1998, 1999; Gilman et al. 2006; Wethey & Woodin 2008.

E N D
Progress towards large-scale analyses of mussel body temperatures K. Allison Smith University of South Carolina 2007 NASA Earth Systems Science Fellow
Helmuth 1998, 1999; Gilman et al. 2006; Wethey & Woodin 2008
Ultimate Goal: Estimate Temperature Driven Mortality Percent Mortality
Helmuth 1998, 1999; Gilman et al. 2006; Wethey & Woodin 2008
What sources of weather data produce the best estimated mussel body temperatures? Helmuth 1998, 1999; Gilman et al. 2006; Wethey & Woodin 2008
What sources of weather data produce the best estimated mussel body temperatures? - quality - large scales Helmuth 1998, 1999; Gilman et al. 2006; Wethey & Woodin 2008
Reanalyzed Data Satellite Data Biomimetic Logger Weather Station www.NOAA.GOES.gov
Hopkins Marine Station, Monterey, California 2000-2006 Local North America Global
Daily Max Body Temperature Biomimic
Daily Max Body Temperature Biomimic
Forecast Verification • Based on Weather Forecasts www.bom.gov.au/bmrc/wefor/staff/eee/verif/verif_web_page.html WWRP/WCRP Joint Working Group on Verification • Why Verify? • Monitor Forecast Quality • Improve Forecast Quality • Compare Forecast Systems
Forecast Verification • Based on Weather Forecasts www.bom.gov.au/bmrc/wefor/staff/eee/verif/verif_web_page.html WWRP/WCRP Joint Working Group on Verification • What Makes a Forecast “Good”? • Consistency • Quality • Value
Daily Max Body Temperature Compared to Biomimetic Logger • A = Weather Station • At research site • 10-minute intervals • C = North American Regional Reanalysis (NARR) with GOES Shortwave Downward Flux • 32 km pixel (NARR) and 55 km pixel (GCIP) • 3-hour intervals and 1-hour intervals • I = Global Reanalysis • 277 km pixel • 6-hour intervals
Conclusions • Data Assemblage “C” • MAE = Acceptable (within 0.5°C of “A”) • Not modeling the stressful temperatures…
Future Directions • Add in SST products • Interpolate to a smaller grid size • Particularly important for global measurements • Conduct analyses at two additional sites • Long-Range Goal • GCM output into body temperature model to make predictions about future mortality events for mussels
Acknowledgements • David Wethey (Modeling) • Brian Helmuth (Biomimic Data) • Mark Denny (Weather Station Data) • NASA Earth Systems Science Fellowship • Elsie Tabor Travel Grant • NASA Grants NNG04GE43G, NNX07AF20G • NOAA Ecofore grant NA04NOS4780264