Download
1 / 16
160 likes | 266 Views
Salford Secondary Schools GCSE Results 2010. Headlines. Provisional results indicate that 50% students gained 5+A*-C including English and maths, an improvement of 12% since 2007. Salford was at least 8% below the national average in 2007 and previous years. In 2010 the gap has narrowed to 3%.

E N D
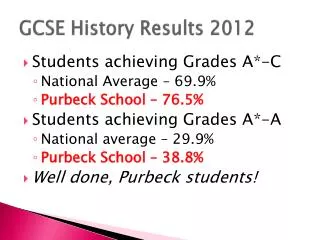
Headlines • Provisional results indicate that 50% students gained 5+A*-C including English and maths, an improvement of 12% since 2007. • Salford was at least 8% below the national average in 2007 and previous years. In 2010 the gap has narrowed to 3%. • The target for 2010 (48.5%) has been exceeded by 1.5% • Over the past six years Salford's GCSE results have improved from 38% of pupils achieving 5 more A* to Cs in 2004 to 83 % for 2010.
% 5A*-C including English and maths – Our statistical neighbours
% 5+ GCSEs A*-C including English and maths – Greater Manchester LAs
Central Locality *Three year improving trend*Rise between 2009 and 2010*Fall between 2009 and 2010
West Locality *Three year improving trend*Rise between 2009 and 2010*Fall between 2009 and 2010
North Locality *Three year improving trend*Rise between 2009 and 2010*Fall between 2009 and 2010
South Locality *Three year improving trend*Rise between 2009 and 2010*Fall between 2009 and 2010
Next steps • to continue the strong upward trajectory in attainment at Key Stage 4, in all schools, and • to narrow the attainment gaps.