Download
1 / 29
290 likes | 463 Views
Bullying Victimization in Delaware. DE-PBS Annual Celebration April 29, 2014. Information to be Covered. 2013 Delaware School Climate Survey - Student results related to bullying Importance of other school climate factors in relation to bullying

E N D
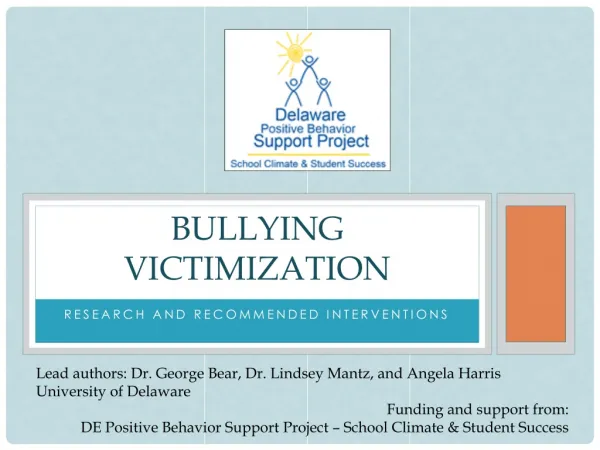
Bullying Victimization in Delaware DE-PBS Annual CelebrationApril 29, 2014
Information to be Covered • 2013 Delaware School Climate Survey -Student results related to bullying • Importance of other school climate factors in relation to bullying • Bullying victimization of students with disabilities • Implications for bullying prevention
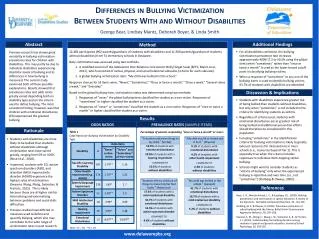
Bullying School-Wide • Items • “Students threaten and bully others in this school” • “Students worry about others bullying them in this school” • “In this school, bullying is a problem” • “Students bully one another in this school” • Scores range from 1 (Strongly Disagree) to 4 (Strongly Agree) • Note: A high score for this subscale is unfavorable
Bullying Victimization Item Examples • Verbal Bullying • “A student said mean things to me.” • Physical Bullying • “I was pushed or shoved on purpose.” • Social/Relational Bullying • “A student told/got others to not like me.” • Cyberbullying • “A student sent me a mean or hurtful message about me using email, text messaging, instant messaging, or similar electronic messaging.” • Scores range from 1 (Never) to 6 (Everyday)
Total School Climate by Student Grade • Student perceptions tend to decrease, especially from elementary to middle school
The following percentages agreed or strongly agreed that bullying was a problem in their school: School-wide Bullying Results
School-wide Bullying Results – grades 3-5 The following percentages agreed or strongly agreed that bullying was a problem in their school:
School-wide Bullying Results – grades 6-8 The following percentages agreed or strongly agreed that bullying was a problem in their school:
School-wide Bullying Results – grades 9-12 The following percentages agreed or strongly agreed that bullying was a problem in their school:
Bullying Victimization Results Percentages indicate the number of students who reported this occurring to them at least once a week:
Bullying Victimization Results Percentages indicate the number of students who reported this occurring to themat least once a week:
Bullying Victimization Results Percentages indicate the number of students who reported this occurring to themat least once a week:
School Climate and Bullying • Caution: Correlation does not mean causation • Direction of influence is likely to be bidirectional: • Bullying creates a negative climate, and a positive school climate helps prevent bullying
Bullying and Students with Disabilities Percentage of parents responding “once or twice a month” or more: “A student said mean things to my child” (Verbal) “My child was bullied in this school” (General) • 41.7% of students with Emotional Disturbance • 6.6% of students with Other Health Impairment • 5.9% of students withSpecific Learning Disability • COMPARED TO • 5.2% of students without disabilities • 50.0% of students with Emotional Disturbance • 12.2%of students with Other Health Impairment • 27.3%of students with Visual Impairment • 20.0%of students with Hearing Impairment • COMPARED TO • 10.2% of students without disabilities
Bullying and Students with Disabilities “Students left my child out of things to make him/her feel badly” (Social/Relational) “My child was hit or kicked and it hurt” (Physical) Percentage of parents responding “once or twice a month” or more: • 9.1% of students with Emotional Disturbance • 4.2%of students with Hearing Impairment • 9.1%of students with Visual Impairment • 3.4%of students with Autism Spectrum Disorder • COMPARED TO • 2.3% of students without disabilities • 16.7% of students with Emotional Disturbance • 8.7%of students with Hearing Impairment • 27.3%of students with Visual Impairment • 14.5%of students with Autism Spectrum Disorder • COMPARED TO • 4.6% of students without disabilities
General Implications for Bullying Prevention • Students report less bullying in schools with a positive school climate and where teachers emphasize the use of techniques for developing strong teacher-student relationships and students’ social and emotional skills • Theory and research show that responsiveness(support) and demandingness(structure) are two essential dimensions of school climate and bullying prevention • Thus, Tier 1 prevention should focus on improving those aspects of school climate
Implications for Bullying Prevention • Students with disabilities are at greater risk for being bullied, but especially those with ED, HI, VI, and OHI • Additional prevention efforts at Tiers 2 and 3 should be considered for these populations, as well as others who are at greatest risk for being bullied (or for bullying others)
Implications for Bullying Prevention • SW-PBS program fidelity is important • Differences between Delaware schools in school climate, bullying and the extent to which they are implementing SW-PBS • Prevention efforts should be guided by a comprehensive needs assessment to determine the areas in which your school should devote resources to train staff • Delaware Assessment of Strengths and Needs for PBS (DASNPBS) • DE-PBS Key Feature Evaluation
Questions? George Bear: gbear@udel.edu Debby Boyer: dboyer@udel.edu Sarah Hearn: skhearn@udel.edu Lindsey Mantz: lmantz@udel.edu www.delawarepbs.org Thank you!