Download
1 / 1
10 likes | 120 Views
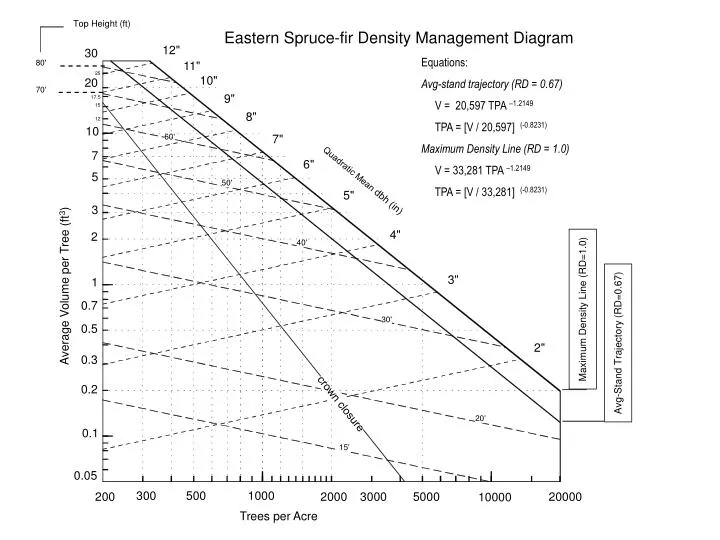
Top Height (ft). Eastern Spruce-fir Density Management Diagram. 12". 30. Equations: Avg-stand trajectory (RD = 0.67) V = 20,597 TPA –1.2149 TPA = [V / 20,597] (-0.8231) Maximum Density Line (RD = 1.0) V = 33,281 TPA –1.2149 TPA = [V / 33,281] (-0.8231). 80'.

E N D
Top Height (ft) Eastern Spruce-fir Density Management Diagram 12" 30 Equations: Avg-stand trajectory (RD = 0.67) V = 20,597 TPA –1.2149 TPA = [V / 20,597] (-0.8231) Maximum Density Line (RD = 1.0) V = 33,281 TPA –1.2149 TPA = [V / 33,281] (-0.8231) 80' 11" 25 10" 20 70' 9" 17.5 15 8" 12 10 60' 7" 7 6" 5 Quadratic Mean dbh (in) 50' 5" 3 4" 2 40' 3" 1 Average Volume per Tree (ft3) Maximum Density Line (RD=1.0) 0.7 30' 0.5 Avg-Stand Trajectory (RD=0.67) 2" 0.3 0.2 crown closure 20' 0.1 15' 0.05 300 500 1000 200 2000 3000 5000 20000 10000 Trees per Acre