Download
1 / 27
270 likes | 348 Views
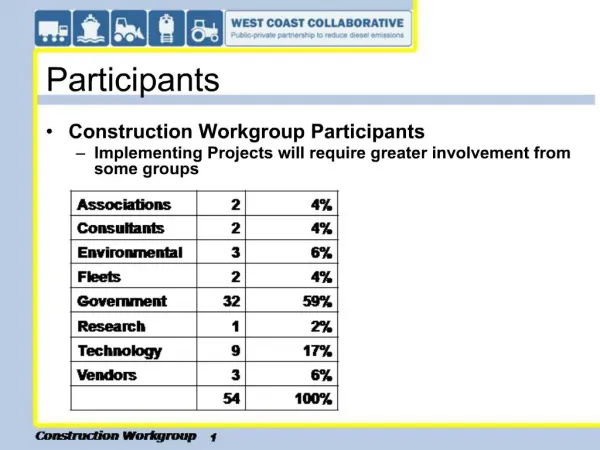
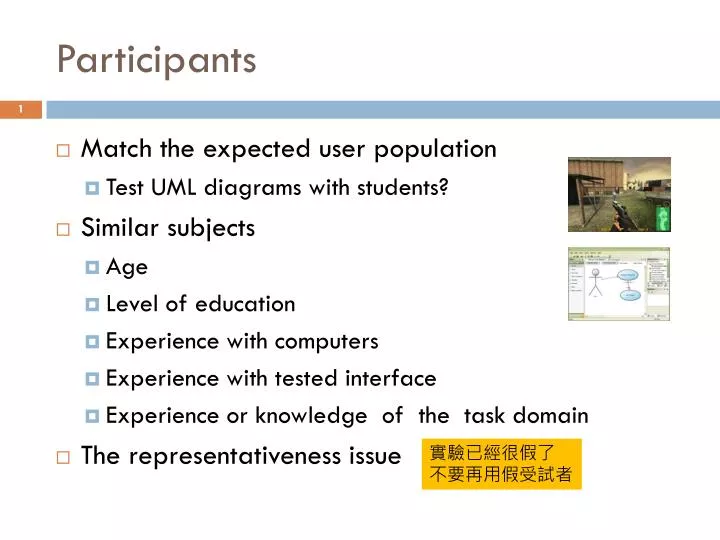
Participants. Match the expected user population Test UML diagrams with students? Similar subjects Age Level of education Experience with computers Experience with tested interface Experience or knowledge of the task domain The representativeness issue. 實驗已經很假了 不要再用假受試者.

E N D
Participants • Match the expected user population • Test UML diagrams with students? • Similar subjects • Age • Level of education • Experience with computers • Experience with tested interface • Experience or knowledge of the task domain • The representativeness issue 實驗已經很假了 不要再用假受試者
Participants • Pragmatic considerations • Nielsen and Landauer • Usability testing with a single participant will find about a third of the usability problems • Little to be gained from testing with more than five • For observation-based studies (alandix) • Alan dix • >= 10
Variables • Independent variables • manipulated to produce different conditions for comparison • Levels • Dependent variables • Measured • Ex: Usability metrics • Hypotheses
User perceptions of security, convenience and usability for ebanking authentication tokens Computers & Security, 28 (2009), pp. 47-62
Independent Variable all small and portable as similar as possible to control extraneous variables
Instruction Page Two-factor authentication
Tasks Data collection: Satisfaction Data collection: Overall Log on Find Account Balance Do Transaction (Type 1, 2, 3) Confirmation Log off Device A or B or C randomization T0 Log on Find Account Balance Do Transaction (Type 1, 2, 3) Confirmation Log off Device A or B or C T1 Log on Find Account Balance Do Transaction (Type 1, 2, 3) Confirmation Log off Device A or B or C T2 Log on Find Account Balance Do Transaction (Type 4) Confirmation Log off Pick one device Counter- balance T3
Participants • Bank customers using e-banking services • 50 participants • Balanced by age (35 & 35) • 50% vs. 50% • Also balanced by gender • M: F = 24: 26 • Usage • At home (92%); at work (32%); at college or int. café (4%)
Analysis on Log-on Time Repeated-measures ANOVA with age and gender as the between-subject factors: F = 126.1; df = 1.167; p < 0.001 Younger < Older p = 0.058 Post hoc pairwise comparisons (Bonferroni) PB < CA; PB < PIN; CA < PIN
Analysis on Confirmation Time Repeated-measures ANOVA with age and gender as the between-subject factors: F = 49.162; df = 1.427; p < 0.001 Post hoc pairwise comparisons (Bonferroni) PB < CA; PB < PIN; CA < PIN Younger < Older p < 0.0001 With all three devices
Analysis on Effectiveness • No errors made • Need to re-orient • 0% access Help page • No errors made • Failing to insert the card before pressing the button • No assistance needed due to the on-screen instructions • 0% access Help page
Analysis on Effectiveness • Assistance needed (9) • Using PINs as OTPs • Using the default ‘CODE’ • Trouble in entering PIN • Often re-boot • Little instruction reading • Complain … • 4% access Help page
Analysis on Mean Usability Repeated-measures ANOVA with age and gender as the between-subject factors: F = 81.040; df = 2; p < 0.0001 Post hoc pairwise comparisons PB > CA; PB > PIN; CA > PIN
Analysis on Perceived Quality Repeated-measures ANOVA with age and gender as the between-subject factors: F = 25.5; df = 1.45; p < 0.0001 Post hoc pairwise comparisons PB > CA; PB > PIN; CA > PIN female < male p = .003
Analysis on Perceived Convenience Repeated-measures ANOVA with age and gender as the between-subject factors: F = 141.26; df = 1.56; p < 0.0001 Post hoc pairwise comparisons PB > CA; PB > PIN; CA > PIN female < male p = 0.035
Analysis on Perceived Security Repeated-measures ANOVA with age and gender as the between-subject factors: F = 21.84; df = 1.59; p < 0.0001 Post hoc pairwise comparisons PB < CA; PB < PIN; CA < PIN
3.4 Heuristics Evaluation What is wanted Analysis Design Evaluation
Heuristic Evaluation • J. Nielsen & R. Molich • Use heuristics • General principles • Domain-specific rules • ‘Discount usability’ method • How to do • Several evaluators for 75% of the problems • Independent review
Nielsen’s 10 Heuristics Error prevention Recognition rather than recall Help and documentation Visibility of system status Match between system and the real world User control and freedom Consistency and standards Flexibility and efficiency of use Help users recognize, diagnose, and recover from errors Aesthetic and minimalist design