Download
1 / 142
1.42k likes | 1.55k Views
Using StateCU Crop Consumptive Use Model. Background Information Examples of how to use StateCU: Climate Station Scenario Wizard Walkthrough Additional Considerations Results Structure Scenario Wizard Walkthrough Additional Considerations Results. Wednesday, March 21, 2012.

E N D
Using StateCUCrop Consumptive Use Model • Background Information • Examples of how to use StateCU: • Climate Station Scenario • Wizard Walkthrough • Additional Considerations • Results • Structure Scenario • Wizard Walkthrough • Additional Considerations • Results Wednesday, March 21, 2012
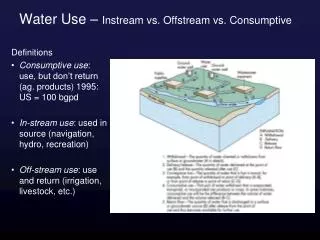
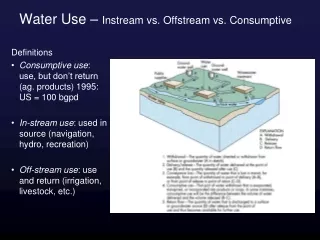
Historic Consumptive Use • Historical consumptive use (HCU) should be quantified month-by-month comparing monthly diversion records against the monthly irrigation water requirement (IWR). • Comparing long-term average monthly diversions and IWR will result in an incorrect historical consumptive use value. Water long months moderate water short months, which will show HCU when water was not diverted or available from soil moisture. • The portion of the historical diversions non-consumed are return flows. • Return flows can be surface flows or groundwater return flows. • Timing of return flows need to be considered. • Return flows must be maintained in time and location as part of a water rights change case.
HCU Data Needs • Climate Data • ET Methods • Crop Characteristics and Coefficients • Irrigated Lands – Acreage, Crop Types, Soils • Etc.
Colorado’s Decision Support Systems CDSS is a great starting point for HCU analyses. • CDSS Website • Suite of Tools
Suite of Tools • TSTool • StateDMI • StateCU
TSTool • Time Series Tool • Displays • Manipulates • Analyzes • Write various formatted output files • Links to HydroBase • Can use external files
StateDMI • Data Management Interface (DMI) • Creates Modeling Input Files • Processes and Formats data • Two Modes • StateCU • StateMod • Links to HydroBase
StateCU • Crop Consumptive Use Model • Practical Application • Software • Scenarios • Methods
StateCU • Practical Application of StateCU • Potential Consumptive Use • Irrigation Water Requirement • Water Supply Limited Consumptive Use • Individual field or farm • Ditch-wide analysis • River basin-wide analysis
StateCU • Software • Graphical User Interface (GUI) • New Scenario Wizard • FORTRAN executable program
StateCU • Scenarios • Climate Station • Potential Consumptive Use (PCU) • Crop Irrigation Water Requirement (CIR or IWR) • Structure • Water supply limited by structure • Water supply limited by structure considering ground water • Water supply limited by structure and priority
StateCU • Methods • Through the GUI • Monthly: • Original Blaney-Criddle • Modified Blaney-Criddle • Pochop (for bluegrass only) • Daily: • ASCE Standardized Penman-Monteith(Wizard is not setup to create a daily dataset at this time)
StateCU • Methods • Through DOS executable • Monthly: • Original Blaney-Criddle • Modified Blaney-Criddle • Pochop (for bluegrass only) • Daily: • ASCE Standardized Penman-Monteith • Penman-Monteith • Modified Hargreaves
Where to start a HCU analysis? • Quick General Information Analysis • Climate Station Scenario • Potential Evapotranspiration (ET) • Crop Irrigation Water Requirement (CIR or IWR)
Climate Station Scenario • Climate Station Scenario • Wizard Walkthrough • Additional Considerations • Results
Climate Station Scenario • The Wizard has now created the dataset. • Data has been saved into a default location: C:\CDSS\Data\STATECUWIZARD\[scenario name] • What is next?
Climate Station Scenario • Slight detour • Effective Precipitation Methods • None • Monthly Methods (monthly or daily analyses) • SCS TR-21 • United States Bureau of Reclamation (USBR) • Daily Methods (only daily analyses) • Max Total Inches Per Day • Fraction of Total Precipitation • SCS NEH4
Effective Precipitation Methods • SCS TR-21 (Monthly) • Re = (0.7091*Rt0.82416 – 0.11556)*(10(0.02426*cu))*F • Re - monthly effective precipitation • Rt- total monthly precipitation • cu - monthly consumptive use (potential ET) • F - function of D • D - the net depth of application • F = 0.531747 + 0.295164(D) – 0.057697(D2) + 0.003804(D3) • It should be noted that Re cannot exceed monthly precipitation or consumptive use. When this happens, Re is set equal to the lesser of the two.
Effective Precipitation Methods • USBR (Monthly) • Linearly related to precipitation. • Re = 0.95 * RtRt<1.0 inch • Re = 0.90 * (Rt – 1.0) + 0.95 1.0<Rt<2.0 inches • Re = 0.82 * (Rt – 2.0) + 1.85 2.0<Rt<3.0 inches • Re = 0.65 * (Rt – 3.0) + 2.67 3.0<Rt<4.0 inches • Re = 0.45 * (Rt – 4.0) + 3.32 4.0<Rt<5.0 inches • Re = 0.25 * (Rt – 5.0) + 3.77 5.0<Rt<6.0 inches • Re = 0.05 * (Rt – 6.0) + 4.02 Rt>6.0 inches
Effective Precipitation Methods • Max Total Inches Per Day • User-specified maximum effective precipitation in inches per day. • Re = Rt if Rt is less than or equal to the user- specified maximum effective rainfall, otherwise: • Re = User supplied maximum value.