Download

1 / 19
190 likes | 359 Views
USING DUMMY VARIABLES. OUTLINE. Types of relationship: spurious, enhancement, specification (interactive) Creating “dummy” variables Using dummy variables: In enhancement relationships (change of intercept but not of slope)

E N D
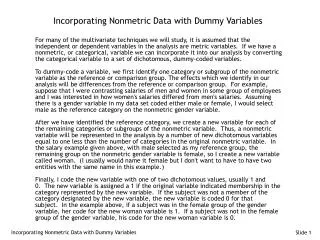
OUTLINE • Types of relationship: spurious, enhancement, specification (interactive) • Creating “dummy” variables • Using dummy variables: • In enhancement relationships (change of intercept but not of slope) • In interactive relationships (change of slope as well as of intercept) • Illustration: Religion, Wealth, and Politics
TYPES OF RELATIONSHIP • Spurious(relationship between Y and X1 vanishes in presence of X2) • Enhancement(inclusion of X2 yields higher R2 than equation with just X1—i.e., affects strength of relationship) • Specification--or “interaction” (inclusion of X2 affects form of relationship between Y and X1)
CREATING “DUMMY” VARIABLES • Transform categorical variables into interval-scale variables • Coding convention: 0, 1 • Binary form for each permutation: e.g., North (0, 1), South (0, 1), East (0, 1), West (0, 1)
ILLUSTRATION 1: RELIGION, WEALTH, AND POLITICS Y = support for Democratic Party (%) X1 = per capita wealth X2 = predominant religion (0 = non-Catholic, 1 = Catholic; 0 = non-Jewish, 1 = Jewish; 0 = non-Protestant, 1 = Protestant)
ILLUSTRATION 2:GOVERNMENTAL PERFORMANCE AND POLITICAL REGIMES
PROBLEMS AND QUESTIONS Disenchantment with democracy in Latin America—are popular judgments fair? 1. How to assess democratic performance in Latin America? 2. What comparison group for Latin America? 3. How to measure democratic vs. nondemocratic performance across comparison group?
BASIC HYPOTHESES • H1: The greater the prevalence of democratic rule, the greater the provision of material benefits. • H2: The greater the prevalence of undemocratic (authoritarian) rule, the greater the provision of material benefits. • H3: The prevalence of democratic or undemocratic rule bears no systematic relationship to the relative provision of material benefits.
DATA AND VARIABLES • Universe=Middle income countries—55 in lower-middle, 41 in upper-middle, N=96 • Time frame=1990-2004 • Units of analysis=country-years • Dependent variables= • Annual GDP growth rate (%) • Infant Mortality (per 1,000) • Primary School Enrollment (%)
INDEPENDENT VARIABLES • Region @ World Bank (0, 1) • Democracy @ Freedom House (0, 1) • Level of democracy @ Smith, Ziegler: • Liberal (0, 1) • Illiberal (0, 1) • Semidemocratic (0, 1) • Nondemocratic (0, 0) • Note: Use of dummy variables
CONTROL VARIABLES • Wealth: • Upper/lower income bracket (0, 1) • GDP per capita (1990, 2000) • Structure: • Manufacturing as % GDP (1990, 2000)
FORMAT FOR REGRESSIONS Ŷ = a + b1Wealth + b2Structure + biRegioni … bkRegionk Ŷ = a + b1Wealth + b2 Structure + b3 Democracy
POLITICAL DETERMINANTS __Growth__ __Mortality__ __Schooling__ (1,088) (277) (369) Democracy (0, 1) .4206 -10.1158* 6.0896* Nondemocracy (0, 0) ----- ---- ---- Constant: 3.9562* 84.2483* 77.0707* R2 .0822 .5336 .1758 *Significant at .001 level or better.
DEMOCRACY BY REGION __ Growth__ __ Mortality__ __ Schooling__ (1,032) (266) (346) Latin American & Caribbean Democracy (0, 1) .2373 -11.8388* 8.5104* Other Democracy (0, 1) .3569 -10.4353* 4.5804* Nondemocracy (0, 0) ---- ---- ---- Constant: 3.9008* 83.8488* 76.6599* R2 .0690 .5336 .2027 *Significant at .01 level or better.
IMPLICATIONS… #1. Democratic governments in Latin America and elsewhere have performed at least as well as authoritarian regimes in promoting economic growth. #2. Democratic governments in Latin America and elsewhere have consistently outperformed authoritarian regimes with regard to infant mortality and school attendance. #3. The deeper the democracy, the greater the provision of fundamental social benefits. [not shown here]
… AND CAVEATS Analysis of variance around the mean does not resolve legitimate public concern about the level of the mean: Average growth is 3.2% not 8.2%. Mean infant mortality is 30 per 1,000 not 10. Average primary school attendance is 89% instead of 99%. And so on.