Download
1 / 14
140 likes | 302 Views
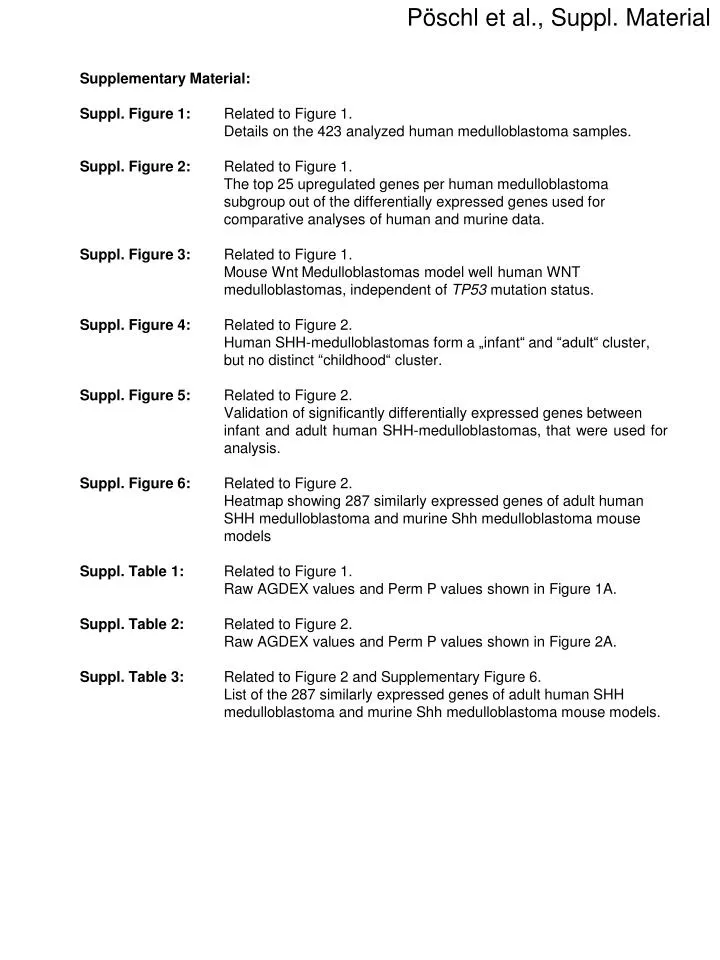
Pöschl et al., Suppl . Material. Supplementary Material: Suppl . Figure 1: Related to Figure 1. Details on the 423 analyzed human medulloblastoma samples. Suppl . Figure 2: Related to Figure 1.

E N D
Pöschl et al., Suppl. Material • Supplementary Material: • Suppl. Figure 1: RelatedtoFigure 1. • Details on the 423 analyzed human medulloblastomasamples. • Suppl. Figure2: RelatedtoFigure1. • The top 25 upregulated genes per human medulloblastomasubgroup out ofthedifferentiallyexpressed genes usedforcomparativeanalysesof human andmurinedata. • Suppl. Figure3: RelatedtoFigure 1. • Mouse WntMedulloblastomasmodelwell human WNT medulloblastomas, independentofTP53mutationstatus. • Suppl. Figure4: RelatedtoFigure2. • Human SHH-medulloblastomas form a „infant“ and “adult“ cluster, but nodistinct “childhood“ cluster. • Suppl. Figure5: RelatedtoFigure 2. • Validation ofsignificantlydifferentiallyexpressed genes betweeninfantand adult human SHH-medulloblastomas, thatwereusedforanalysis. • Suppl. Figure6: RelatedtoFigure 2. • Heatmapshowing 287 similarlyexpressed genes ofadult human SHH medulloblastomaandmurineShhmedulloblastomamousemodels • Suppl. Table 1: RelatedtoFigure 1. • RawAGDEX valuesand Perm P valuesshown in Figure 1A. • Suppl. Table 2:RelatedtoFigure 2. • Raw AGDEX valuesand Perm P valuesshown in Figure2A. • Suppl. Table 3:RelatedtoFigure2 andSupplementaryFigure 6. • List ofthe 287 similarlyexpressed genes of adult human SHH medulloblastomaandmurineShhmedulloblastomamousemodels.
Pöschl et al., Suppl. Figure 1 67.7% Molecular subgroup WNT SHH Group 3 Group 4 n [% of all patients] 53 [12.53] 112 [26.48] 94 [22.22] 164 [38.77] Agegroup n % of subgroup n % of subgroup n % of subgroup n % of subgroup Infant ( ≤ 3 years) 0 0 29 25.89 25 26.6 8 4.88 Child (> 3 < 16 years) 44 83.02 27 24.11 63 67.02 131 79.88 Adult ( ≥ 16 years) 9 16.98 54 48.21 3 3.19 22 13.41 Not available 2 1.79 3 3.19 3 1.83 Gender n % of subgroup n % of subgroup n % of subgroup n % of subgroup Female 28 52.83 53 47.32 28 29.79 48 29.27 Male 25 47.17 59 52.68 66 70.21 116 70.73 M stage n % of subgroup n % of subgroup n % of subgroup n % of subgroup M - 40 75.47 77 68.75 57 60.64 86 52.44 M + 5 9.43 14 12.5 31 32.98 60 36.59 Not available 8 15.09 21 18.75 6 6.38 18 10.98 Histology n % of subgroup n % of subgroup n % of subgroup n % of subgroup Classic 49 92.45 38 33.93 59 62.77 123 75 Desmoplastic 0 0 42 37.5 5 5.34 9 5.49 Extensively nodular 0 0 3 2.68 0 0 0 0 Large cell/ anaplastic 4 7.55 16 14.29 19 20.21 18 10.98 Medullomyoblastoma 0 0 0 0 3 3.2 0 0 Not available 0 0 13 11.61 8 8.51 14 8.54 10 year survival rate 97.8% 61.8% 43.5% SupplementaryFigure 1: Epidemiological and clinical data of the 423 analyzed human medulloblastoma samples.
Pöschl et al., Suppl. Figure 2 SHH WNT Group 3 Group 4 SupplementaryFigure 2: Heatmapshowingthe top 25 upregulated genes per human medulloblastomasubgroup. High expressionisshown in red, lowexpressionisshown in blue.
Pöschl et al., Suppl. Figure 3 TP53 Status Histology Gender Age group Histology Classic (n=34) Status Alive (n=31) Dead (n=2) TP53 TP53 mutated (n=4) TP53 WT (n=30) Age group Child (n=27) Adult (n=7) Gender Female (n=20) Male (n=14) data not available SupplementaryFigure3A: Non-hierarchicalaveragelinkageclustering (20% variancefilter) of 34 human WNT tumorswithknownTP53mutationstatus.The fourTP53mutated WNT tumorsdidnot clustertogether.
Pöschl et al., Suppl. Figure 4 Age group: Infant (≤ 3 years; n=29) Child (> 3 years < 16 years; n=27) Adult (≥ 16 years; n=54) SupplementaryFigure 4: Based on geneexpression, SHH childhoodmedulloblastomacases do not form a distinctcluster. Hierarchicalclusteringbased on significantlydifferentiallyexpressed genes using an “infant“, “childhood“ and “adult“ groupdistinguished an “infant“ and “adult“ cluster, but nodistinct “childhood“ cluster. Insteadchildhoodtumorsclusteredvariablytothe “infant“ or “adult“ SHH subgroup, withthemajoritybeenfound in the „adult“ subgroup.
Pöschl et al., Suppl. Figure 5 Northcott dataset 200 (out of 332) Current dataset 705 101 Age group Infant (n=29) Adult (n=54) -2 0 +2 Supplementary Figure 5: 705 genes were found to be significantly differentially expressed between infantile and adult human SHH medulloblastomas in the current dataset (out of 10333 orthologue genes present on all examined platforms). The Venn diagramm shows the overlap of significant genes with the Northcott study (Northcott et al. 2011a). The Northcott study identified 332 significant differentially expressed genes – of these 200 were also present in our current dataset. 101 genes were found to be differentially expressed in both studies. Expression of these 101 genes in our dataset is displayed in the heatmap.
Pöschl et al., Suppl. Figure 6 SHH infant (n=29) Mouse models n=64 SHH adult (n=54) -2 0 +1.5 SupplementaryFigure 6: Heatmapshowing 287 signifcantdifferentiallyexpressed genes whencomparinghuman infant SHH medulloblastoma to human adult medulloblastoma and murine medulloblastoma models. Details on the genes can be found in table S3.
Pöschl et al., Suppl. Table 1 Supplementary Table 1: Raw AGDEX valuesand Perm P valueswhencomparing different murinemedulloblastomamodelstothefoursubgroupsofmedulloblastoma. The bestmatchforeachmodelishighlighted in orange.
Pöschl et al., Suppl. Table 2 Supplementary Table 2: Raw AGDEX values and Perm P values when comparing different murine Shh medulloblastoma models to infantile or adult human SHH medulloblastoma cases. Best matches of each model are highlighted in orange.
Pöschl et al., Suppl. Table 3 Suppl. Table 3: 287 genes thataresimilarlyexpressed in adult human SHH medulloblastomaandmurineShhmedulloblastomamousemodelsandsignificantlydifferfrom infantile human SHH medulloblastoma.