Download
1 / 72
1.09k likes | 2.15k Views
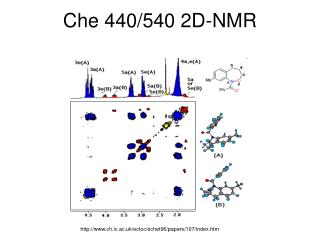
How to Analyze of 2D NMR Spectra ( small molecules). 2009. 12. 28 노 정 래. Conventional proton spectrum ( 1 H NMR). Pulse width (pw). 1 H. FT. 1 H and 13 C NMR spectra (Chemical shifts, d ). Carbon spectrum ( 13 C NMR). (Coupled carbon spectrum). 13 C. 1 H. 13 C. CHCl 3 (1% ).

E N D
How to Analyzeof 2D NMR Spectra ( small molecules) 2009. 12. 28 노 정 래
Conventional proton spectrum (1H NMR) Pulse width (pw) 1H FT
Carbon spectrum (13C NMR) (Coupled carbon spectrum) 13C 1H 13C CHCl3 (1% ) 1H 13C 1H 13C Bo FT JCH coupling
Carbon spectrum (13C NMR) (Decoupled carbon spectrum) Pulse width (pw) 1H 13C 13C CHCl3 (1% ) 1H 13C BB
13CH3 13CH2 13CH 13C H H H C C C C H H H Coupled Carbon Decoupled Carbon Nuclear Overhauser Effect (nOe)
Proton-Proton coupling constant (JHH) JHH JHH JHH Not through space, but through bonds
The order of magnitude and sign of scalar couplings * Usually negative, but sometimes positive Factors influencing scalar coupling - Hybridization of the atoms - Bond lengths - Bond angles and dihedral angles - Substituent effects - The presence of neighboringp-bonds
Connectivity of protons and carbons 2-methylpent-1-en-3-ol
Relation between Men and their friend’s partner (remote coupling)
New Techniques employed in modern NMR experiments • Direct Detection • low sensitivity (low natural abundance) • long time for multidimensional NMR experiment 1H 13C • Indirect Detection (Inverse Detection) • high sensitivity • short time for multidimensional NMR experiment 1H 13C
H-C-Cl3 1H 12C 99%( inactive) JCH=216 Hz 1H 13C 1% (active) natural (1% 13C) labeling (70% 13C)
Comparison of spectrum using phase cycling and PFG • Phase cycling ( it is necessary to select interested signals with several scans) = + scan 2 scan 1 sum • PFG ( select interested signals or eliminate the unwanted signals with one PFG pulse In case of dense sample - gives spectrum in short time - gives clean spectrum One scan
Pulse Field Gradient (PFG) 1H PFG y y Field strength x x Bo dz
Pulse Field Gradient (PFG) PFG y y y x x x
Origin 2D Data t2 t1 Dt = 1/J t1
Production of 2D NMR spectrum t1 t2 FT (t2) t2 t1 FT (t1)
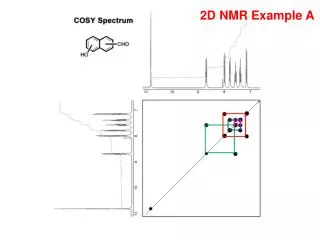
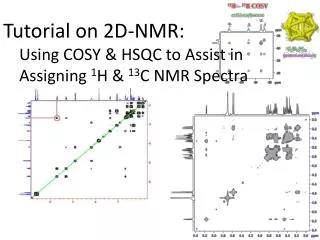
COSY spectrum (COrrelation SpectroscopY) 90 90 Ha / Hb F1 t1 t2 Ha cross peak diagonal peaks FT(t1, t2) 1H COSY spectrum 128 x 1024 (256 x 1024) 256 x 1024 (512 x 1024) 512 x 1024 (1024 x 2048) Hb F2 1H Ha Hb 4JHH = 0-18 Hz 1 3JHH Ha = 0-30 Hz 2JHH 2 Hb t1 3 Ha C Hb 4 C C t2
COSY spectrum and its Interpretation c a d b e e e Hb / Hc He Hd Hc Ha Hb c c C C C C C C d d b b a a diagonal peak → cross peak → diagonal peak
COSY spectrum and its Interpretation c a d b e f f Hf Hd Hc Ha Hb ( ) b C C C C C C He c d e a diagonal peak → cross peak → diagonal peak
COSY spectrum and its Interpretation c a b/e d f f He Hf Hd Hc Ha Hb ( ) b/e C C C C C C C Overlapped signals c b c d b d a diagonal peak → cross peak → diagonal peak
TOCSY (TOtal Correlation SpectroscopY) d b c a 90 Mixing pulse 60~80ms t2 t1 a c b d FT(t1, t2) TOCSY spectrum 128 x 1024 (256 x 1024) 256 x 1024 (512 x 1024) 512 x 1024 (1024 x 2048) 3 3JHH 3JHH 3JHH 1 4 Hd Hc Ha Hb t1 t2 2 C C C C
TOCSY spectrum and its Interpretation c a b/e d f f f He Hf Hd Hc Ha Hb b/e b/e C C C C C C C c c d d a a
Pairing 1H and 13C Shifts by using the HSQC / HMQC spectrum Ca HMQC (Heteronuclear Multiple Quantum Correlation) / HSQC (Heteronuclear Single Quantum Correlation) Cb 13C 1JCH = 125-250 Hz 1H Ha 1/2JCH t2 FT(t1, t2) t1 Hb HSQC spectrum 128 x 1024 (256 x 1024) 256 x 1024 (512 x 1024) Ha Hb 1H 1JCH 2 1 13C 1H 13C t1 t2 Ca 4 3 1Hb 1Ha 1JCH 1JCH Cb O Ca Cb
HMQC/HSQC spectrum and its Interpretation O H H H H C C O C C H a b d c H H H c b d a CH3, a CH3, d 1H CH2, b 13C
Assignment of Nonprotonated 13C’s on the basis of the HMBC spectrum HMBC (Heteronuclear Multiple Bond Correlation) 90 180 t2 1/2JCH t1 FT(t1, t2) 1/2nJCH HMBC spectrum 128 x 1024 (256 x 1024) 256 x 1024 (512 x 1024)
HMBC spectrum and its Interpretation Ha Hb O Hd Hd Ca Ha Cb O Cc Cd Ha Hb Hd a c b d a d 1H b 13C
Determining Stereochemistry by using the NOESY / ROESY spectrum NOESY/ROESY( Nuclear Overhauser Effect Spectroscopy) 90 90 90 Mixing pulse 200 ms NOESY t1 t2 90 Mixing pulse 350 ms FT(t1, t2) ROESY t2 t1 NOESY/ROESY spectrum NOE NOE t2 Hc Hb Ha t1 C C C NOE diagonal peak → cross peak → diagonal peak a b 2JHH NOE / COSY c
DEPT (Distortionless Enhancement by Polarization Transfer) 1/2J 1/2J 1/2J CH CH3 CH2
DEPT spectrum and its interpretation b d c a e 4-hydroxy-3-methyl-2-butanone CH3 (DEPT- 45)+(DEPT-135)-(DEPT- 90) DEPT-135(CH + CH3 - CH2) CH2 (DEPT- 45)-(DEPPT-135) DEPT- 90 (CH) CH DEPT- 90 DEPT- 45 (CH + CH2 + CH3) DEPT- 45 All protonated e d c b a 13C spectrum 13C spectrum 220 200 180 160 140 120 100 80 60 40 20 0 220 200 180 160 140 120 100 80 60 40 20 0 DEPT spectra Pure subspectra
I . Assignment of Resonances to Atoms Within a Molecule Assigning 1H Resonances on the basis of Chemical Shifts Assigning 1H Resonances on the basis of the COSY spectrum Assigning 13C Resonances on the basis of Chemical Shifts Pairing 1H and 13C Shifts by using the HSQC / HMQC spectrum Assignment of Nonprotonated 13C’s on the basis of the HMBC spectrum Determining Stereochemistry by using the NOESY / ROESY spectrum
II. Elucidation of Unknown Molecular Structures Initial Inspection of the one-dimensional spectra : 1H and 13C Pairing 1H and 13C Shifts by using the HSQC / HMQC spectrum List the1H -13C data in tabular form Establishment of connectivity between protons on the basis of the gCOSY spectrum Assignment of Nonprotonated 13C’s on the basis of the HMBC spectrum Determining Stereochemistry by using the NOESY / ROESY spectrum
Problem 1 C9H9ClO2 MW=184.62 1H NMR * Problem1 and 2 are selected from “Organic Structure Determination Using 2-D NMR Spectroscopy” - J. H. Simpson, 2008
13C NMR Thecarbon signal at 157.0 ppm is lost
Problem 2 1H NMR C7H12O2
Problem 3 1H spectrum 2.33 2.26 3.64 7.37 (d, 8.0) 7.24 (dd, 8.0, 7.4) 8.06 (d, 7.7) 10.8 7.04 (dd, 7.7, 7.4)
13C spectrum 142.6 139.5 138.3 136.9 127.0 123.8 122.8 121.9 118.0 108.5 110.2 109.6 13.4 12.5 60.6 x x x
COSY Spectrum 7.37 7.24 7.04 8.06
Expanded HMBC Spectrum 108.5 138.3 136.9 127.0