Download
1 / 33
330 likes | 485 Views
Lightning Climatology Oklahoma Lightning Mapping Array May - September, 2004 - 2005. Paul Krehbiel New Mexico Tech September 28, 2005. Lightning Mapping Arrays (LMAs). Utilize time-of-arrival technique Consist of 10-12 stations over 50-70 km diameter area

E N D
Lightning Climatology Oklahoma Lightning Mapping Array May - September, 2004 - 2005 Paul Krehbiel New Mexico Tech September 28, 2005
Lightning Mapping Arrays (LMAs) • Utilize time-of-arrival technique • Consist of 10-12 stations over 50-70 km diameter area • Passive system: locates impulsive radio frequency signals produced by lightning (radio 'static') • Listens in a locally unused VHF TV channel (e.g., Ch 3, 5, 8) • Produce observations in near real-time (1-2 minute delay) • Provide good spatial accuracy and temporal resolution Existing systems: • New Mexico Tech LMAs: Northern Alabama (NASA/Huntsville), Oklahoma (OU/NSSL), Langmuir Laboratory (NMT), WSMR, ... • Vaisala (formerly GAI) LDAR II: Dallas/Ft. Worth, Houston (TAMU), Kennedy Space Center.
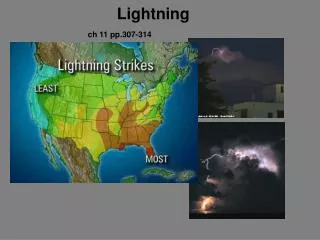
Oklahoma LMA data: • Real time observations: • Cover a large area (400-500 km diameter) • 3D over 200-300 km diameter area • Data are simultaneous; short update times (2 min) Useful information: • Plan source densities (vertically integrated) • Altitude vs. time source density plots Lightning activity shows where strong convection is occurring, and if intensifying or weakening (See lightning.nmt.edu)
Zoomed-in example: Density of Points Display Moore, OK tornadic storm May 10, 2003 10 min of observations (NLDN events in green) -> xlma analysis software Texas
Climatology Data from Oklahoma LMA The following slides show on a month-by-month basis the number of located LMA sources as a function of the day of the month and the hour of each day, in the form of a 3-dimensional bar graph (generated using the ‘bar3’ plotting tool of Matlab). The vertical bars indicate the number of sources per hour on a logarithmic scale to prevent large mesoscale systems from dominating the plots. The units are kilosources/hour, with a threshold value of 1000 sources/hour being applied to discriminate against weakly-detected, distant storms from cluttering up the presentation (any storm of reasonable size and within range of the LMA will produce several thousand sources/hour). To determine what the storms look like during an active period, see http://lightning.nmt.edu/oklma. (Bar graphs are shown only for April through September but are available for the entire year.)
Number of located LMA sources, April 2004, Oklahoma (Daylight ~12-24 UTC; 7 am – 7 pm CDT)
Number of located LMA sources, April 2005, Oklahoma (Daylight ~12-24 UTC; 7 am – 7 pm CDT)
Number of located LMA sources, May 2004, Oklahoma (Daylight ~12-24 UTC; 7 am – 7 pm CDT)
Number of located LMA sources, May 2005, Oklahoma (Daylight ~12-24 UTC; 7 am – 7 pm CDT)
Number of located LMA sources, June 2004, Oklahoma (Daylight ~12-24 UTC; 7 am – 7 pm CDT)
Number of located LMA sources, June 2005, Oklahoma (Daylight ~12-24 UTC; 7 am – 7 pm CDT)
Number of located LMA sources, July 2004, Oklahoma (Daylight ~12-24 UTC; 7 am – 7 pm CDT)
Number of located LMA sources, July 2005, Oklahoma (Daylight ~12-24 UTC; 7 am – 7 pm CDT)
Number of located LMA sources, Aug. 2004, Oklahoma (Daylight ~12-24 UTC; 7 am – 7 pm CDT)
Number of located LMA sources, Aug. 2005, Oklahoma (Daylight ~12-24 UTC; 7 am – 7 pm CDT)
Number of located LMA sources, Sept. 2004, Oklahoma (Daylight ~12-24 UTC; 7 am – 7 pm CDT)
Number of located LMA sources, Sept. 2005, Oklahoma (Daylight ~12-24 UTC; 7 am – 7 pm CDT)
For real-time data plots, archived daily and hourly, see http://lightning.nmt.edu/oklma
Lightning Climatology STEPS 2000 Lightning Mapping Array (NW Kansas, E Colorado, SW Nebraska) May 24 – August 10, 2000
Two supercell storms in NW Kansas–SW Nebraska - June 7, STEPS 2000 -13 station LMA network - Close storm: Low Precip - Far storm: High Precip - 10 min time interval - ~Continuous IC lightning - Inverted polarity storms (deep mid-level + charge) - Only one NLDN event - negative CG (real?) - Major advantage of total lightning vs. CG only Note: Major Ch 3 TV interference, data processed with auto- thresholding.
Aircraft track and storms, May 25, STEPS 2000 (Aircraft being charged while flying through down- wind cirrus/anvil cloud)
Example of Highly Dendritic Negative CG flash Height vs Time Height vs E-W Plan View Height vs N-S
Number of located LMA sources, May 2000, STEPS (Daylight ~12-02 UTC; 6 am – 8 pm MDT)
Number of located LMA sources, June 2000, STEPS (Daylight ~12-02 UTC; 6 am – 8 pm MDT)
Number of located LMA sources, July 2000, STEPS (Daylight ~12-02 UTC; 6 am – 8 pm MDT)
Number of located LMA sources, August 2000, STEPS (Daylight ~12-02 UTC; 6 am – 8 pm MDT)
Time-of-Arrival Concept: impulsive lightning event at (x, y, z; t) z y x
Oklahoma Lightning Mapping Array 11 station network, 50 km diameter Real-time processing & display University of Oklahoma/National Severe Storms Laboratory
North Alabama Lightning Mapping Array (NASA) Map (10 stations) http://branch.nsstc.nasa.gov/ One hour of real-time data
Portable LMA System (Vortex II, DC Network, DC3?) • Electronics housed in shielded thermoelectric cooler enclosure • Operate from external 12 VDC battery and/or power supply. ~12 (+48) watts power • Battery operation: 48+ hours (w/out cooling) 20+ hours (with cooling) • Lightweight (10 lbs) • ¼ wave ground plane antenna (Ch. 8 shown; 180-186 MHz) • Connected to receiver in box by coaxial cable • Other external connectors: GPS antenna, ethernet, 12 VDC