Download
1 / 16
160 likes | 313 Views
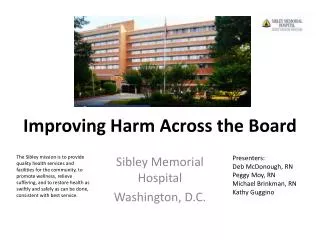
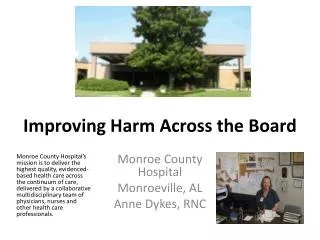
Improving Harm Across the Board. Kathleen M. Louth Director of Quality Management Monroe County Hospital P. O. Box 1068 Forsyth, GA 31029 478.994.2521 ext. 2150 klouth@monroehospital.org. Hospital Trend Rate in Reducing Harm. *HAC harm = inpatient hospital acquired conditions.

E N D
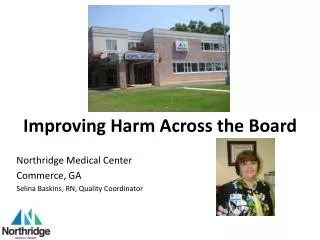
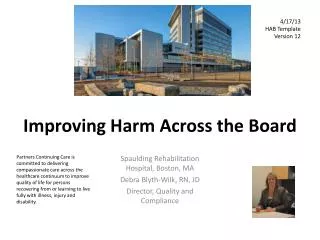
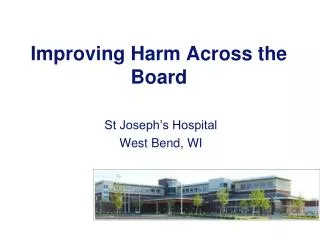
Improving Harm Across the Board Kathleen M. Louth Director of Quality Management Monroe County Hospital P. O. Box 1068 Forsyth, GA 31029 478.994.2521 ext. 2150 klouth@monroehospital.org
Hospital Trend Rate in Reducing Harm *HAC harm = inpatient hospital acquired conditions
30 Day Total Readmission Rate All Cause *all cause 30 day readmissions
Pearls Multidisciplinary • It is not just the work of the Quality Improvement Department; all departments must be involved • Must be a collaborative effort from the top-down and bottom-up • Increased communication and input from management staff Assign ownership and expectations • Establish timelines for project deliverables • Continue to meet with definite reporting timeframes Educate • Keep the staff, medical staff, and board informed
DefiningMoments In Our Journey Defining Moments & Commitment to Patient Safety: • 2009-New CEO who had experience in Quality & Patient Safety; new Director of Quality Management hired • 2010- Patient Safety Plan & Commitment to Patient Safety developed; revised incident reporting system & tools; fall team formed; medication error team formed; Quality Council & reporting revised; education of changes to all (hospital wide); Culture of Patient Safety Survey implemented; Patient Safety Week recognized • 2011-Fall prevention program revised; education of changes to all (hospital wide); Glycemic Control team formed; CLABSI team formed
DefiningMoments In Our Journey • 2012- Participation in the Hospital Engagement Network (HEN) & education to management team; Regrouped on readmissions due to data issues; formation of Readmission Reduction team; OATS team formed; HCAHPS training; CAUTI team formed; Marketing of Patient Safety through website, banners, boards, & local newspaper • 2013-Strategies to reduce readmissions implemented-bedside shift reporting, white boards, rounding (hourly, nurse manager, leadership), discharge follow up calls, follow up appointments made, discharge folder, pharmacist educating high risk patients, follow up calls for ER patients, working with hospice and home heath agencies, participating in GMCF Care Transitions, participating in MATCH, Patient & Family Engagement; Case Manager position job duties aligned with reducing readmission efforts to include discharge process
Breakthrough Strategy • Major Challenges Encountered • Limited Resources (human, time, financial) • Implementation of EHR • Culture change • Training • Strategies to Overcome • Time management, utilizing resources from the HEN • Constant education and re- education, dedicated point person for EHR • Reinforcement of rationales, hearing stories from peers at other facilities • Make it fun, pertinent, convenient, personal, and using personalized teaching methods
Slide 10 Risk Profile: The Areas of Risk We Are Committed To Controlling Annual discharges: 378 year 2010 HAC risk opportunities/discharge: 4.37
Slide 11 Our improvement journey Improvement Scale:The stages we move through Number of risk areas (0-11) at each stage • IDEAL: level represents zero harm • At Target: level represents meeting improvement target • Progress: level shows movement but not yet at target • Opportunity: level is an opportunity to launch aggressive action 7 1 0 0
Pictured 1st row left to right:Shawnelle Lupton, Operating Room Nurse Manager; Dr. Dana Peterman, PT, DPT; Casey Fleckenstein, Medical/Surgical Nurse ManagerPictured 2nd row left to right:Dr. Craig Caldwell, Past President of the Medical Staff/Hospital Authority Board Member; Sherry Mays, Clinical Coordinator; Kathleen Louth, Director of Quality Management; and Tim Allen, Director of Engineering and Environmental Services.Not pictured:Kay Floyd, CEO; Tony Ussery, Chairman of the Quality Council/Vice Chairman of the Hospital Authority Board; Megan Randall, Director of Radiology; Pam Lankford, Emergency Room Nurse Manager; Hugh Cromer, Director of Pharmacy; Laura Roush, Director of Laboratory; Jean Riley, Director of Respiratory Therapy/Infection Control; Cindy Renno, Dietary Manager; Ticia Hicks, Case Management; Michelle Wiggins, Swing Bed Coordinator; and Mamie Patterson, Diabetes Support Group.
Next big step to Reduce Harm • Continue our efforts that we already started • Enhance patient & family engagement • Implement teach back