Download
1 / 11
110 likes | 231 Views
2.6 Graphs of rational functions. Rational functions. Let f and g be polynomial functions with g(x) ≠ 0. then the function given by r(x) = f(x) is a rational function g(x)

E N D
Rational functions Let f and g be polynomial functions with g(x) ≠ 0. then the function given by r(x) = f(x) is a rational function g(x) (both f(x) and g(x) don’t have to be expression, you must have a variable in the denominator though)
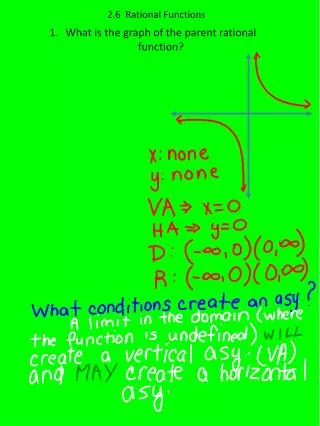
Finding domain & end behavior To determine domain: set denominator = 0 and solve. The domain will be all real #’s except for q (where x = q) To write: (-∞, q) U (q, ∞) **if the denominator is a quadratic, you may have 3 intervals End behavior: determine if the y values are going to ∞ or -∞ as x -∞ and x ∞
VA’s and HA’s HA’s: the line y = b is a horizontal asymptote of the graph of f if f(x) approaches a limit of b as x approaches +∞ or - ∞: lim f(x) = b or lim f(x) = b x -∞ x ∞ VA’s: the line x = a is a vertical asymptote of the graph of f if f(x) approaches a limit of +∞ or -∞ as x approaches a from either direction: lim f(x) = ±∞ or lim f(x) = ±∞ x a- x a+ a_ : x approaches from the left, a+: x approaches from the right (this is on p. 93 of your textbook) **If this is confusing, do it how I showed you before**
Transformations Do exploration 1 on p. 219 on your own or with your tablemate Examples: describe how the graph can be obtained by transforming the graph of the reciprocal function. Identify HA’s, VA’s, and use limits to describe its end behavior. Sketch the graph. 1. f(x) = -2 x + 5 2. f(x) = 1 + 2 x 3. f(x) = 3x – 2 x - 1
Limits and Asymptotes Graphically: plug it into the calculator and look at where the asymptotes appear to be Algebraically: solve like we’ve been doing, remember if the domain is all real numbers there is no VA
Example 1. f(x) = 3x2 x2 + 1 Graph it: VA: none (since x2 + 1 > 0, the domain is all real numbers), HA: y = 3 Algebraically: VA: x2 + 1 = 0, x2 = -1, since √ -1 is non-real, there are no VA’s HA: compare the exponents, since they are the same, y = 3/1 or y = 3 To describe the limits: lim f(x) = lim f(x) = 3 x -∞ x ∞
Example 2. f(x) = x – 3 x2+3x Graphically: don’t forget to put parenthesis around the numerator & denominator Algebraically: VA: x2+3x=0,x(x + 3) = 0, x = 0 & x = -3 HA: y = 0 (since 1 < 2) Limits: lim f(x) = -∞, lim f(x) = ∞ x -3-x -3+ lim f(x) = -0, lim f(x) = 0 x -∞x ∞
Graph of a rational function Graph of f(x)/g(x) = axn/bxm 1. end behavior asymptotes: If n< m, the end behavior asymptote (EBA) is the HA y = 0 If n = m, the EBA is the HA y = a/b If n >m, the EBA is the quotient polynomial function y = q(x), this is a slant asymptote. There is no HA in this case. 2. VA: these occur at real 0’s of the denominator provided that the 0’s aren’t also 0’s of the numerator 3. x-intercepts: these occur at the real 0’s of the numerator, which aren’t also 0’s of the denominator 4. y-intercepts: this is the value of f(0), if defined
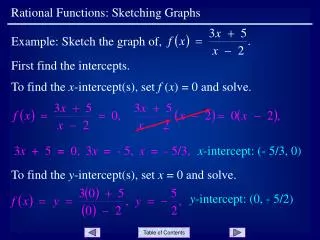
Graphing f(x) = x + 2 x2 + 2x – 3 EBA: y = 0 since 1 < 2 VA: x = -3 & 1 (x2 + 2x – 3 = 0, (x + 3)(x – 1) = 0) X-intercepts: (-2, 0) x + 2 = 0, x = -2 Y-intercepts: (0, -2/3) (f(0) = (0+2)/(02 + 2(0) – 3) = 2/-3 = -2/3) Sketch the graph: graph on the calculator – EBA, VA, and intercepts must be exact
Graphing Try one: Find the EBA, VA, X-intercepts, y-intercepts and sketch the graph of: 1. f(x) = 2x2 – 1 x2 + 3 2. f(x) = x + 1 x2 – 3x - 10