Download
1 / 27
270 likes | 388 Views
Pre-flares observed by RHESSI. Marina Battaglia ETH Z ürich Lyndsay Fletcher Glasgow University Arnold O. Benz ETH Z ü rich. 1. Energy release and particle acceleration. ?. Energy release due to reconnection of magnetic field lines. Corona. ?. Where is the actual

E N D
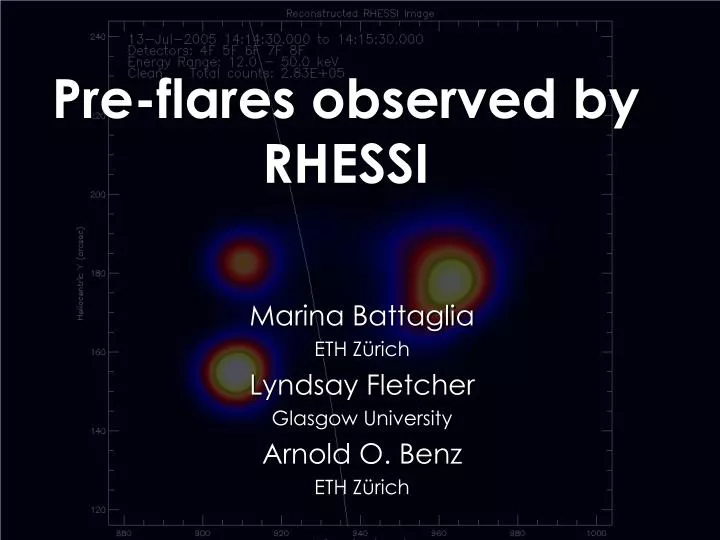
Pre-flares observed by RHESSI Marina Battaglia ETH Zürich Lyndsay Fletcher Glasgow University Arnold O. Benz ETH Zürich
1. Energy release and particle acceleration ? • Energy release due to • reconnection of magnetic • field lines Corona ? Where is the actual acceleration site? B0 Photosphere
Dense, hot region in the corona → soft X-rays • hard X-rays from accelerated electrons Corona How was this dense region formed? Photosphere
2. Particles stream down to chromosphere Corona Assumption: force free transport Photosphere
3. Stopping in the dense chromosphere • hard X-ray bremsstrahlung • →chromospheric footpoints • heating of chromosphere Corona footpoints Photosphere
4: Expansion of hot plasma (chromospheric “evaporation”) → soft X-ray emission Corona Photosphere
Expected lightcurve in the common flare scenario RHESSI 6-12 keV (SXR) RHESSI 25-50 keV (HXR)
~ 3 min RHESSI 6-12 keV (SXR) RHESSI 25-50 keV (HXR) RHESSI 25-50 keV (HXR)
SXR emission starts 3 minutes before the HXR emission • There must be hot material already present and the amount of hot material seems to increase RHESSI 25-50 keV (HXR)
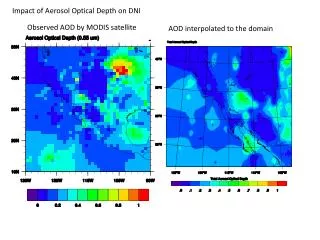
Observations of pre-heating • Analyze 4 events displaying pronounced pre-heating, using data from the RHESSI and GOES X-ray satellites • Analyze the time evolution of the early flare phase in images and spectra
Spectral and spatial evolution of pre-heating RHESSI 6-12 keV (SXR) RHESSI 25-50 keV (HXR)
solar disc 6-12 keV 12-25 keV 25-50 keV Time 0 min
solar disc 6-12 keV 12-25 keV 25-50 keV Time 0 min 1 min Time
solar disc 6-12 keV 12-25 keV 25-50 keV Time 0 min 1 min 3 min Time
Spectra fit range fit range non-thermal tail appears Beginning: purely thermal
Spectral and spatial evolution of pre-heating Lightcurves 6-12 keV 25-50 keV GOES Emission measure RHESSI Temperature Density assuming constant volume
Emission measure and density increase: material is added to the coronal source region (assuming constant source volume) • Most likely origin: chromosphere • No footpoints, no HXR → standard electron beam model not applicable
Energy transport by heat conduction • Coronal temperature ~ 20 MK • Typical chromospheric temperature ~ 10000 K • → large temperature gradient, drives heat flux • Classical: (Spitzer conductivity)
Conductively driven evaporation vs beam driven evaporation electron beam heat flux energy deposition in chromosphere energy deposition in chromosphere heating of chromospheric plasma / HXR emission heating of chromospheric plasma “chromospheric evaporation” “chromospheric evaporation” density increase in coronal source density increase in coronal source
Very large temperature gradients result in heat flux that the plasma is unable to carry → flux saturation • Threshold for saturation is determined by the electron mean free path (n,T) and the temperature scale length T/∆T≈ Lloop
Temperature and density space of typical flares with limits for classical heat flux with GOES (dots) and RHESSI (triangles) measurements
The heat flux in the presented events is limited • Classical treatment is not applicable – contrary to widely made assumption • Use the limited heat flux Fsat=Fcond where (/Lloop) is a correction factor derived by Campbell (1984)
Conductively driven evaporation • Energy is deposited to the chromosphere due to thermal conduction • → heating, evaporation, but no HXR emission
From the time evolution of the density, the energy flux Fevapof the evaporated material was computed • Fevap < Fsat → the conductive energy input causes enough evaporated material to account for the observed density increase
Summary, Conclusions & open questions • The pre-heating phase in flares observed by RHESSI was studied • The observed increase in density can be explained by conductively driven chromospheric evaporation • Contrary to often made assumptions, the conductive heat flux is saturated and a non-classical treatment is necessary