Download
1 / 99
1k likes | 1.18k Views
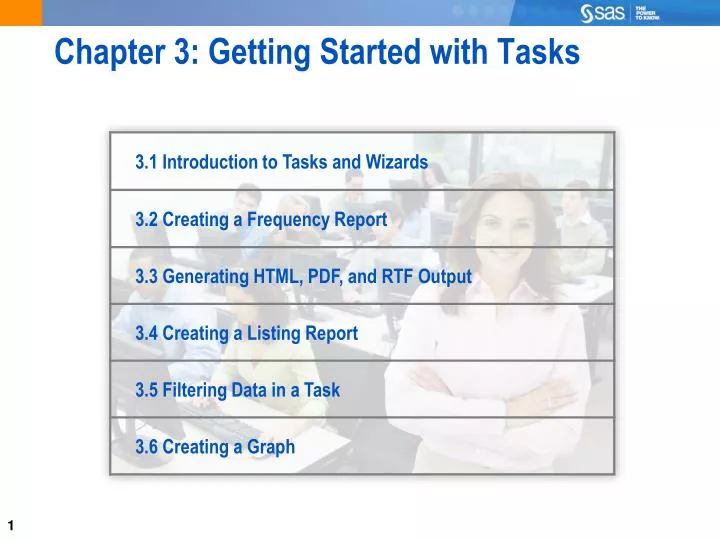
Chapter 3: Getting Started with Tasks. Chapter 3: Getting Started with Tasks. Objectives. Define a SAS Enterprise Guide task and wizard. Name one method of accessing tasks in SAS Enterprise Guide. State the functions of common features in the task dialog boxes. What Is a Task?.

E N D
Objectives • Define a SAS Enterprise Guide task and wizard. • Name one method of accessing tasks in SAS Enterprise Guide. • State the functions of common features in the task dialog boxes.
What Is a Task? A task is a specific type of analysis, report, or data manipulation that you can perform against data in a project. A task is typically referenced by its description.
3.01 Quiz Select the Tasks menu in your SAS Enterprise Guide session. Which tasks might be the most helpful in working with your data?
Associating a Task with Data Selecta task. Highlight the data in the Project Tree. Tasks are usually associated with a particular data source in the project.
Associating a Task with Data Tasks can also be selected from the menu in the data grid.
Tasks: Selection Pane Selection Pane Each task dialog box follows a similar format that includes a Selection pane that lists the options available for that task.
Tasks: Data Help is displayedwhen a Task roleis selected. Select Data to define how columns are used to create the task result.
Tasks: Titles and Footnotes Type customtitles orfootnotes. Select Titles to add descriptive titles and footnotes.
Tasks: Properties Task properties can be modified to rename the task, examine task attributes, and modify the output format.
Task Wizards Selected tasks have a wizard format that can be used to set up the task results quickly.
Working with Tasks Task code, log, output data, and results are available for viewing and further analysis through tabs and menus.
Working with Tasks Tasks can be refreshed or modified from either the Project Tree, the Process Flow window, or the Results tab.
Objectives • Access the One-Way Frequencies task. • Generate a one-way frequency report and bar chart.
Business Scenario Orion management wants a report that counts the number of products offered for each category.
One-Way Frequencies Task The One-Way Frequencies task can be used to generate frequency counts, percentages, graphs, and statistical tests to analyze the distribution of your data.
3.02 Multiple Choice Poll • Highlight any data source in the project and select Tasks Describe One-Way Frequencies. Which task role requires a variable assignment? • Analysis variables • Frequency count • Group analysis by
3.02 Multiple Choice Poll – Correct Answer • Highlight any data source in the project and select Tasks Describe One-Way Frequencies. Which task role requires a variable assignment? • Analysis variables • Frequency count • Group analysis by
One-Way Frequencies: Task Roles The One-Way Frequencies task produces a one-way frequency report for each variable included in the Analysis variables role. .
One-Way Frequencies: Task Roles The Group analysis role can be used to produce separate frequency reports for each unique value of a variable.
3.03 Quiz Open the One-Way Frequencies task again by selecting Tasks Describe One-Way Frequencies. In the Tasks Roles window, select Help and read the description for the Frequency count role. How many variables can be assigned to this role?
3.03 Quiz – Correct Answer Open the One-Way Frequencies task again by selecting Tasks Describe One-Way Frequencies. In the Tasks Roles window, select Help and read the description for the Frequency countrole. How many variables can be assigned to this role? 1
One-Way Frequencies: Additional Options Use additional options to customize the report or create a data set with frequencies and percentages.
Generating a One-Way Frequency Report Orion managers want a report that summarizes the number of products offered for each category.
Exercise This exercise reinforces the concepts discussed previously.
Objectives • List output format options. • Compare the advantages of each output format.
Business Scenario Orion management wants to publish, in an HTML format on the intranet, the frequency report for product categories.
Task Output Formats By default, SAS Enterprise Guide produces task results in SAS Report format. However you can also choose to generate HTML, PDF, RTF, or text output.
SAS Report Format Banner image Bar Chart task SummaryStatistics task One-WayFrequencies task The SAS Report format enables you to combine multiple task results into a single report. This report can be viewed in SAS applications or exported as HTML, XML, or PDF files.
3.04 Multiple Answer Poll • Which output formats would you like to use in your work? • HTML • PDF • RTF • SAS Report • Text
3.05 Quiz What are some advantages of each format?
3.05 Quiz – Correct Answer • What are some advantages of each format? • HTML can be easily viewed by anyone who has a browser. • RTF can be included and edited in common word processors. • PDF is a good choice for printing and sharing static copies of the report. • SAS Report format is useful when you combine task results or create reports to be viewed in other SAS applications. • Text is simple and familiar if you use the SAS Display Manager.
Default Output Format The default output format can be set under Tools Options Results General. Custom options can also be set for each of the output formats.
Overriding the Default Output Format The properties of individual tasks can be modified to override the default format and produce other types of results.
Modifying Output Format This demonstration illustrates modifying the properties of a task to produce HTML, PDF, RTF, or text output.
3.06 Quiz (Live Web Only) Double-click on any One-Way Frequencies task in the project. On the Results tab, select Modify Task. Select Properties Edit Results. Select Customize results formats, styles, and behaviors and select the HTML style. In the drop-down list, change the style to EGDefault. Select OK Run. Select Yes when you are prompted to replace the results.
3.06 Quiz – Correct Answer Confirm the results. Results might be different if you used the One-Way Frequencies task results from the Level 2 or Level 3 exercise.