Download
1 / 26
260 likes | 340 Views
Disclosure. This presentation and discussion will contain

E N D
Disclosure This presentation and discussion will contain forward-looking statements within the meaning of the Private Securities Litigation Reform Act of 1995. Words such as “expects,” “anticipates,” “intends,” “estimates,” or similar expressions are intended to identify these forward-looking statements. These statements are based on Marten’s current plans and expectations and involve risks and uncertainties that could cause future activities and results of operations to be materially different from those set forth in the forward-looking statements. For further information, please refer to Marten’s reports and filings with the Securities and Exchange Commission.
Marten’s Culture People Focused on Today’s Accelerated Business Environment “Managers may believe that industry structures are ordained by the Good Lord, but they can – and often do – change overnight.” “The Discipline of Innovation” Harvard Business Review May-June 1985 By Peter F. Drucker “Perhaps the greatest challenge business leaders face today is how to stay competitive amid constant turbulence and disruption.” “Accelerate!” Harvard Business Review November 2012 By John P. Kotter Konosuke Matsushita Professor of Leadership, Emeritus Harvard Business School
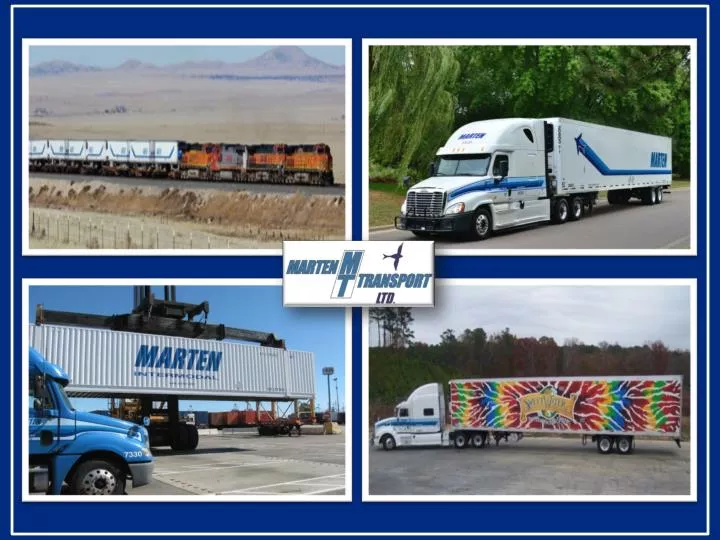
Marten’s Strategic Vision • Multifaceted Transportation Service Solutions • Truckload Business Platform – regional, OTR and dry and refrigerated dedicated operating from 15 regional service centers • Intermodal Business Platform – refrigerated TOFC and dry COFC with extended dray service from Marten’s truck network • MRTN de Mexico Business Platform - door-to-door Mexican business service with our Mexican partner carriers • Brokerage Business Platform – surge flexibility to service our customer needs beyond Marten’s assets Continued business transition with strategic focus on regional, MRTN de Mexico, dedicated and intermodal with dedicated and intermodal both dry and refrigerated
Diverse and Dense Freight Network • Top five accounts – 30% of revenue in 2013 vs. 41% in 2010 • No current account more than 8% of revenue • Load count has increased 27% from 2010 to 2013 • Revenue per tractor has increased 17% from 2010 to 2013
Load Growth 10.2% 7.4% 7.4%
Regional Operating Centers Growth The foundation of Marten’s service and growth Mondovi, WI Corporate Office Wilsonville, OR Mondovi, WI Indianapolis, IN Ontario, CA Tucker, GA 2007 Terminal Locations
Regional Operating Centers Growth The foundation of Marten’s service and growth Mondovi, WI Corporate Office Wilsonville, OR Mondovi, WI Chicago, IL Carlisle, PA Indianapolis, IN Richmond, VA Kansas City, KS Ontario, CA Otay Mesa, CA Memphis, TN Phoenix, AZ Tucker, GA Desoto, TX 2007 Terminal Locations Terminal Locations Added- Only Carlisle, Otay Mesa & Chicago are leased Tampa, FL Laredo, TX
Regional Truckload Operations Growth Dedicated Business Growth Focus in 2013 & 2014 # of Tractors 77.2%* 77.3%* 68.1%* 54.2%* 28.9%* 20.8%* 8.0%* * % of Truckload Fleet
Intermodal Network Growth Seattle Expanded dray service from Marten Transport’s network Bethlehem, PA Portland St Paul Syracuse, NY Worcester CSXT BNSF Chicago Stockton Salt Lake City N Bergen UPRR Chambersburg UPRR Fresno Baltimore Kansas City CSXT NSRR Denver BNSF Los Angeles Greensboro Memphis Atlanta Phoenix BNSF Jacksonville Dallas/Ft Worth Orlando UPRR FEC Miami Mexico 2006 Intermodal Network Rail Terminals Served
Intermodal Network Growth Seattle Expanded dray service from Marten Transport’s network Bethlehem, PA Portland St Paul Syracuse, NY Worcester CSXT BNSF Chicago Stockton Salt Lake City N Bergen UPRR Chambersburg BNSF Fresno Baltimore Kansas City CSXT NSRR Denver BNSF Los Angeles Greensboro Memphis Atlanta Phoenix BNSF Jacksonville Dallas/Ft Worth Orlando UPRR FEC Miami Intermodal Network Additions Mexico 2006 Intermodal Network Rail Terminals Served
Intermodal Growth Initiated temperature-controlled TOFC in ’05 and dry COFC in late ’11 We are the largest truckload intermodal temperature-controlled carrier with BNSF Expanded intermodal growth with longer drayage supported by our regional business platform Yearly Revenue Growth (excluding fuel surcharge) In millions Yearly Load Growth 39% 30% 13% 10% 29% 21% 11% 8% 57% 29%
Brokerage Growth Initiated in 2005 to provide surge capability for our customers Yearly Revenue Growth (including fuel surcharge) In millions Yearly Load Growth 8% 28% -1% 10% 17% 16% 18% 16% 41% 63%
Mexico Growth Door-to-door cost saving solutions Expanded into Western Mexico with Otay Mesa facility in September and moved into new, larger company-owned Laredo facility in December Revenue Growth (including fuel surcharge) In millions 28% 24% 60% 84%
Recognition for Efficiency, Innovation and Integrity • GMI Ratings’ Top 100 Most Trustworthy Companies as Reported by Forbes.com – 4 of last 5 years • Recognized U.S. exchange-listed companies displaying the highest corporate integrity, clear financial reporting and transparent corporate governance • McDonald’s Global Best of Green 2012 Award – October 2013 • SmartWay Excellence Award – October 2013 • Thermo King Energy Efficiency Leader Award – • June 2011 • Commercial Carrier Journal’s Innovator of the Year - January 2011
Net Capital Expenditures In millions
Increasing Tractor Costs Average Monthly Depreciation The monthly depreciation of tractors added in 2013 was 22% higher than the depreciation of tractors traded in 2013
Increasing Trailer Costs Average Monthly Depreciation • The monthly depreciation of trailers added in 2013 was 13% higher than the depreciation of trailers traded in 2013 • New 2013 CARB-required refrigeration units
Miles per Tractor & Revenue per Tractor Growth Average Revenue, Net of Fuel Surcharges, per Tractor per Week Miles per Tractor 2.2% 5.2% 3.8% 5.6% 6.5% -1.8% Miles and revenue per tractor improvement continued even with additional FMCSA hours of service break and restart restrictions effective July 1
Financial Highlights 2013 net income was the highest in Marten’s history We paid our initial regular quarterly dividend of $0.013/share in Q3’10. In Q2’12 we increased the quarterly amount to $0.017/share, and in Q4’12 we also paid a special dividend of $0.50/share In Q2’13 we increased the quarterly dividend by 50% by continuing to pay $0.025/share after our 3-for-2 stock split (All amounts in millions except per share amounts)
Marten People Drive Our Profitable Growth for Truckload, Intermodal, Brokerage and MRTN de Mexico • People Initiate and Implement Our Strategic Vision and Key Strategic Initiatives • “The more they know, the more they’ll understand. The more they understand, the more they’ll care. Once they care, there’s no stopping them.” –Sam Walton • Marten’s culture: Visible costs and operating data to improve and add value daily
Marten People Drive Our Profitable Growth for Truckload, Intermodal, Brokerage and MRTN de Mexico • Sustainable Cost and Productivity Improvements Driven by our People and Ongoing Development of our Systems and Processes • Continuous Revenue per Tractor Growth • Continuous Tractor and Trailer Miles Utilization Improvement • Continuous Fuel MPG Improvement • Continuous Increased Drivers’ Hours • Continuous Customer Collaboration • Increased Customer Diversity • Bottom Line – Improved Utilization Drove a 17% Increase from 2010 to 2013 in Average Truckload Revenue, Net of Fuel Surcharges, per Tractor per Week
Continued Improvement Despite Challenging Industry Headwinds Operating Ratio, Net of Fuel Surcharge Bottom Line – Our People’s Creative Initiatives Make This Continuous Margin Improvement Happen, Despite Constant Disruptions
Continued Improvement Despite Challenging Industry Headwinds Earnings – Cents Per Diluted Share Continuous double-digit earnings growth since the Great Recession 10% 12% 22% 22% 84% increase from 2009 to 2013
Marten’s Culture | Marten’s Vision Marten’s People “Sufficient urgency around a strategically rational and emotionally exciting opportunity is the bedrock upon which all else is built.” “Accelerate!” Harvard Business Review November 2012 By John P. Kotter Konosuke Matsushita Professor of Leadership, Emeritus Harvard Business School Marten’s people have built a strong business platform in turbulent times and we envision our best years in 2014, 2015 and beyond