Download
1 / 69
690 likes | 796 Views
The Frequency Domain & Fourier Analysis Chapter 3 ME 392 February 6, 2012 Week 5. Joseph Vignola. Assignment 3. Assignment 3 was good Please have just your name in the filename for your submission The zip files should contain everything related to your assignment or lab

E N D
The Frequency Domain & Fourier AnalysisChapter 3ME 392February 6, 2012Week 5 Joseph Vignola
Assignment 3 Assignment 3 was good Please have just your namein the filename for your submission The zip files should contain everything related to your assignment or lab Switch lab partners each week, you should not work with the same person twice
Things to Remember Signal that come in and out of a computer don’t have enough power to do much more that drive earphones The 2120 box can put out 12 volts That doesn’t mean that you can hook up jumper cables to it and start your car with it. So SO if the input impedance of what you are trying to power is low, the current demand will be high
Things to Remember LabVIEW for controlling experiments and acquiring data Things like: Sampling frequency Mic sensitivity Should be stored in a data file along with the data Always store unprocessed data (at least as unprocessed as possible)
Things to Remember LabVIEW for controlling experiments and acquiring data Matlab for processing You will use a Matlab Script load the data file and experimental parameters into Matlab for processing This one script will do everything including making and saving final plots
Things to Remember LabVIEW for controlling experiments and acquiring data Matlab for processing Don’t ever make a plot without axis labels and units
Sampled Time Histories Last week we talked about samples time histories In this case it is recorded audio but it could be the temperature or pressure inside an engine or any other type of data
Sampled Time Histories Last week we talked about samples time histories In this case it is recorded audio but it could be the temperature or pressure inside an engine or any other type of data The next thing we want to think about is the periodic or repetitive part of a signal
Sampled Time Histories Last week we talked about samples time histories In this case it is recorded audio but it could be the temperature or pressure inside an engine or any other type of data The next thing we want to think about is the periodic or repetitive part of a signal Fourier’s Theorem tells us that any sequences can be represented as a sum of sinusoids
Sampled Time Histories Last week we talked about samples time histories This is an important idea because we can then represent the same sequence in terms it’s periodic content The next thing we want to think about is the periodic or repetitive part of a signal Fourier’s Theorem tells us that any sequences can be represented as a sum of sinusoids
Sampled Time Histories Last week we talked about samples time histories This is an important idea because we can then represent the same sequence in terms it’s periodic content
Sampled Time Histories Last week we talked about samples time histories The frequency spectrum is a plot that tells you just how much of each frequency is in the original time history
Frequency Spectrum Some signal are dominated by a single tone (a single frequency)
Frequency Spectrum Some signal are dominated by a single tone (a single frequency) Some have a discrete set of frequencies…
Frequency Spectrum Some signal are dominated by a single tone (a single frequency) Some have a discrete set of frequencies… and others have a little bit of a lot of frequencies
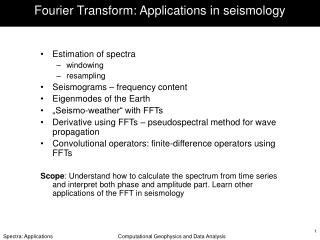
Fourier Transform The Fourier transform is the tool we use to generate a frequency spectrum from a time history
Fourier Transform The Fourier transform is the tool we use to generate a frequency spectrum from a time history The Fourier transform is a lot like the Laplace transform
Fourier Transform The Fourier transform is the tool we use to generate a frequency spectrum from a time history The Fourier transform is a lot like the Laplace transform Fourier transform Laplace transform
Fourier Transform The Fourier transform is the tool we use to generate a frequency spectrum from a time history The Fourier transform is a lot like the Laplace transform Fourier transform Laplace transform Except the transform variable is restricted to
Fast Fourier Transform When we have sampled data rather than a continuous signal we use a “Discrete Fourier Transform” (DFT)
Fast Fourier Transform When we have sampled data rather than a continuous signal we use a “Discrete Fourier Transform” (DFT) Integrals become summations when working with discrete data
Fast Fourier Transform When we have sampled data rather than a continuous signal we use a “Discrete Fourier Transform” (DFT) The most common DFT is the fast Fourier transform (FFT)
Fast Fourier Transform When we have sampled data rather than a continuous signal we use a “Discrete Fourier Transform” (DFT) The most common DFT is the fast Fourier transform (FFT) This is what we will use on LabView and Matlab
Fast Fourier Transform When we have sampled data rather than a continuous signal we use a “Discrete Fourier Transform” (DFT) Before we go any further we should note that measured sequence of values, xn are real numbers but the frequency amplitudes Xk are not.
Fast Fourier Transform When we have sampled data rather than a continuous signal we use a “Discrete Fourier Transform” (DFT) Before we go any further we should note that measured sequence of values, xn are real numbers but the frequency amplitudes Xk are not.
Fast Fourier Transform When we have sampled data rather than a continuous signal we use a “Discrete Fourier Transform” (DFT) It means that each of the sinusoidal components of the time history has both a magnitude and phase.
Fast Fourier Transform When we have sampled data rather than a continuous signal we use a “Discrete Fourier Transform” (DFT) In other words both how big it is and how much it might be shifted right of left.
Aliasing If the phenomena you are measuring is changing faster that you are sampling the measured data won’t adequately represent what is happening
Aliasing If the phenomena you are measuring is changing faster that you are sampling the measured data won’t adequately represent what is happening In fact it’s worse that not capturing the changes in the phenomena at all because will appear to have frequency content that is not real.
Aliasing If the phenomena you are measuring is changing faster that you are sampling the measured data won’t adequately represent what is happening In fact it’s worse that not capturing the changes in the phenomena at all because will appear to have frequency content that is not real. This is called aliasing
Frequency Resolution Imagine a measurement window where you sample at a rate of 1000 samples per second for 100 ms (The window is the part of the response you can see)
Frequency Resolution Imagine a measurement window where you sample at a rate of 1000 samples per second for 100 ms The lowest frequency oscillation you resolve in one full cycle in the measurement window
Frequency Resolution Imagine a measurement window where you sample at a rate of 1000 samples per second for 100 ms The lowest frequency oscillation you resolve in one full cycle in the measurement window This corresponds to the first non zero entry in the FFT
Frequency Resolution Imagine a measurement window where you sample at a rate of 1000 samples per second for 100 ms The second non-zero entry in the FFT corresponds to two oscillations in the window
Frequency Resolution Imagine a measurement window where you sample at a rate of 1000 samples per second for 100 ms The third non-zero entry in the FFT corresponds to three oscillations in the window
Frequency Resolution Question: what do you think the first one corresponds to? The first entry corresponds to an offset or the average value of the collection of values in the time history.
Frequency Resolution Question: what do you think the first one corresponds to? The first entry corresponds to an offset or the average value of the collection of values in the time history.
Frequency Resolution Question: what do you think the first one corresponds to? The first entry corresponds to an offset or the average value of the collection of values in the time history. Twice the mean value
Frequency Resolution Question: what if you don’t an integer number of oscillation in the window? Three oscillation in the window
Frequency Resolution Question: what if you don’t an integer number of oscillation in the window? Then you can’t make the time history with just one sinusoid
Frequency Resolution You can have more than one frequency in the disturbance at a time
Frequency Resolution You can have more than one frequency in the disturbance at a time They both appear in the frequency spectrum
Frequency Resolution 4 oscillations in the measurement window
Frequency Resolution 6 oscillations in the measurement window
Frequency Resolution 8 oscillations in the measurement window
Frequency Resolution 10 oscillations in the measurement window
Frequency Resolution 20 oscillations in the measurement window
Frequency Resolution 30 oscillations in the measurement window
Frequency Resolution 40 oscillations in the measurement window
Frequency Resolution 45 oscillations in the measurement window