Download

1 / 21
210 likes | 216 Views

E N D
Notice: The views expressed here are those of the individual authors and may not necessarily reflect the views and policies of the United States Environmental Protection Agency (EPA). Scientists in EPA have prepared the EPA sections, and those sections have been reviewed in accordance with EPA’s peer and administrative review policies and approved for presentation and publication. The EPA contributed funding to the construction of this website but is not responsible for it's contents. Mention of trade names or commercial products does not constitute endorsement or recommendation for use.
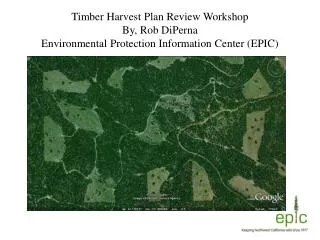
Vulnerability of Mid-Atlantic Forested Watersheds to Timber Harvest Disturbance Rex H. Schaberg Nicholas School of the Environment and Earth Sciences, Duke University Robert C. Abt Department of Forestry, North Carolina State University
Objectives • Describe a simulation using the Subregional Timber Supply (SRTS) model • Prior: developed SE; extended NE • Current: recalibrated to MA watersheds • Explore relative likelihood of harvests among HUC 6 watersheds • Relate to potentially sensitive ecological areas (e.g., aquatic biodiversity “hotspots”) • Consider related land-use impacts • planted pine plantations • urbanization • Focus on results, rather than models and methods
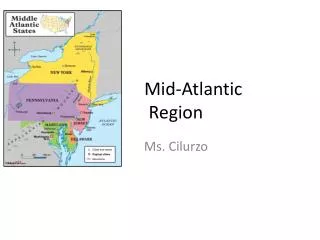
Watershed Based Analysis • We consider 41 HUC6 watersheds • Within 8 Mid-Atlantic States • Over a 28 year period 1998 - 2025 USGS Hydrological classification
Role of Economic Resource Models in Ecological Assessment • Provide a relatively robust vector to drive implicit future trade-offs among ecological benefits • Forest cover in watersheds is highly correlated with many important ecological functions • Commodity production may compete • Economic models can help locate and quantify potential conflicts • SCALE of analysis is necessarilyCOURSE • Triage: In conjunction with GIS snapshots: (econ.) can suggest and (GIS) verify existence of likely stressors • Target monitoring and intervention to areas identified as critical by policymakers
Mid-Atlantic Aquatic Diversity “Hotspots” Species of Conservation Concern • 15% of USGS Huc8 watersheds (327) identified as aquatic “hotspots” for biodiversity preservation • 47 (14%) are within the Mid-Atlantic 8 state region NatureServe; Masters et al. 1998
Land-Use Legacy and Forest Extent • Forests converted to agriculture, harvested (catastrophic fire, erosion) • Percent ecosystem converted or degraded (~ 200 yrs.) • Appalachian/Blue Ridge 83% • Appalachian Mixed Mesophytic: 95% • Southeastern Mixed: 99% • MA forests in recovery throughout last century • Private Forest 77.8 MM acres in 8 MA states (1982) • Fed. land, 7.2 MM acres: much in forest • Forests (esp. hardwood) now at economic maturity • Harvest levels increasing (demand; supply decline PNW) • New market applications: chip mills, oriented strand board • Private forests were 55% of the MA land area in 1982
Timber Availability, Data, Models • Demand for developed land • Decision variable:Most lucrative land use • Timber as byproduct of land conversion • Byproduct => not subregional timber economics • Not modeled in SRTS • USDA Natural Resource Inventory (NRI) data • Market demand for wood products • Furniture, lumber, pallets, pulp mills, OSB, chip mills • USDA Forest Service: forest inventory and analysis (FIA) data • Harvests, growth, inventory • SubRegional Timber Supply (SRTS) Model
Mid-Atlantic Land Use Trends NRI 1997 • All Mid-Atlantic states becoming less rural • All MA rural areas becoming proportionally more forested • Trends in forest extent are highly variable (e.g., NC,NY)
SubRegional Timber Supply (SRTS) Model • Present Analysis (1998–2025) initial assumptions: • Timber demand assumed constant • Timber land acres held constant • Pine plantation acres constant, productivity increased • Industry > 50% by 2025 Private > 30% by 2025 • FIA data converted to HUC 6 watersheds • Objective: characterize relative economic vulnerability • Possible to fine tune with sensitivity analysis
Mid-Atlantic Harvest Summary • Hardwoods predominate, except in NC, VA Coastal Plain region • Total 28 yr. harvest of 30.7 MM acres • Equivalent of 44% of 70.2 MM timberland acres • Will include some multiple harvests on some acres • Annual harvest of 1.56% of timberland/year • Regional forest timber rotation: 64 yrs.
Mid-Atlantic Hardwood Timber: Inventory, Growth, and Removals
Mid-Atlantic Softwood Timber: Inventory, Growth, and Removals
Mid-Atlantic Harvest Extent Harvest Acres 1998 - 2025
Mid-Atlantic Harvest Intensity Cumulative Harvest as a Percent of Forest 1998 - 2025
Mid-Atlantic Harvest:Comparative Patterns of Extent and Intensity Extent Percent
Pine Plantation Extent Percent of watershed forest currently in plantation pine • Regional extent of pine plantations: • 6.53% of forest • Intensive management • High disturbance • Relative frequency • Intensity • High productivity • Reduce pressure elsewhere
Linking Aquatic Biological “Hotspots” With Harvest Trends USGS HUC 8 of conservation concern Percent of watershed acres affected by harvest • Harvest (1998 – 2025) greater than 1MM ac. • OR Forest area % impact • Greater than 50% • Displayed by harvest intensity Species of Conservation Concern
Summary and Conclusions • SRTS doesn’t predict harvest, does predict where given harvests are likely to occur • Southern MA (e.g., NC, VA) qualitatively different than rest of the region • More harvest, more pine, more intensive disturbance • Identify areas that are relatively more vulnerable • Opportunities for improved BMPs • Conservation easements or set asides for critical habitat • In conjunction with other data, may help prioritize monitoring and allocation of management resources
Vulnerability of Mid-Atlantic Forested Watersheds to Timber Harvest Disturbance Rex H. Schaberg Nicholas School of the Environment and Earth Sciences, Duke University Robert C. Abt Department of Forestry, North Carolina State University