Download
1 / 49
490 likes | 496 Views
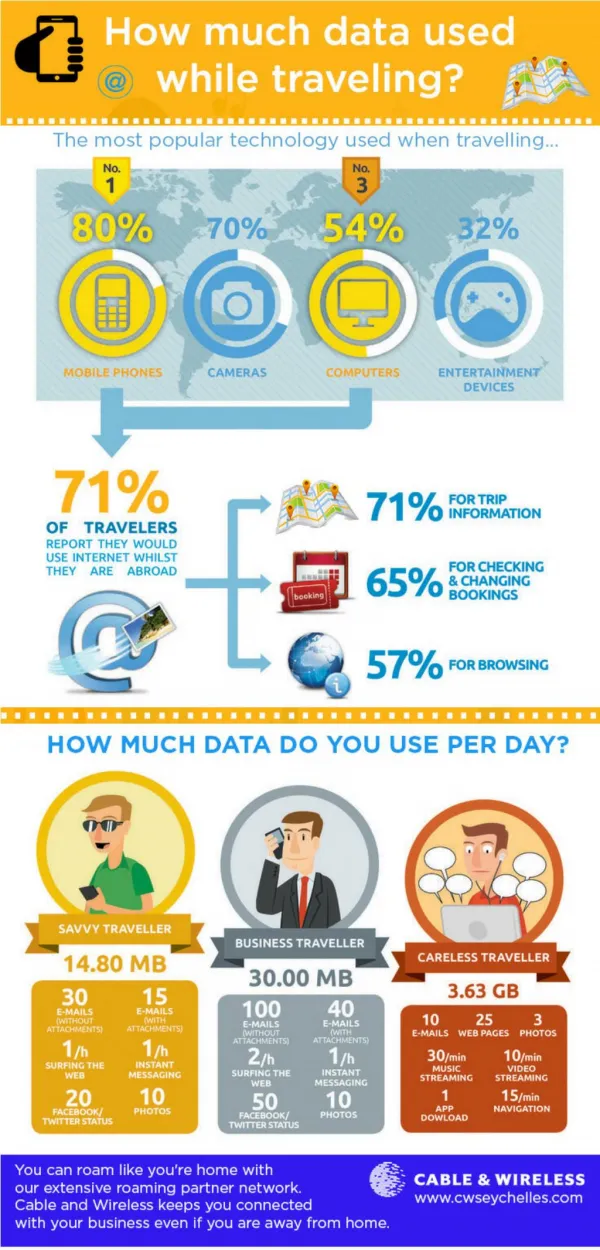
Learn about the importance of data in RCRAInfo and how it is used from various perspectives. Discover how data quality ensures accurate information and supports regulatory development, program evaluations, targeting facilities, compliance monitoring, and more.

E N D
How RCRAInfo Data Are Used 2010 RCRAInfo National Users Conference 1
Dwane YoungEPA – HeadquartersOffice of Resource Conservation and Recovery 2
Data in RCRAInfo are Important • This session will provide four different perspectives/examples of how data in RCRAInfo are used: • Jim O’Leary (EPA HQ) – will give an EPA HQ perspective • Caleb Shaffer (EPA Region 9) – will give EPA Regional perspective • Bud McCarty (NC) – will give North Carolina’s perspective • Verona Barnes (GA) – will give Georgia’s perspective 3
Data Quality in RCRAInfo is Important • Important that we put forth the extra effort to ensure that the data in RCRAInfo accurately reflect what’s going on in the RCRA program • BR data are important, and we need to ensure that these data are accurate • GIS data are important. In order to do effective analysis, we need to know where these Handlers are located 4
An Example of Why Data Quality are Important • 2007 BR data had some significant errors • States, Regions, and HQ put forth a tremendous effort to correct those errors (THANK YOU!) 5
Jim O’LearyEPA – HeadquartersOffice of Resource Conservation and Recovery 6
Importance of BR in Supporting RCRA Program Objectives • Examples of program areas supported by use of BR data • Regulatory development • Program evaluations • Targeting facilities (e.g., potential to recycle) • Program trends • Compliance monitoring • Program implementation • Environmental justice • Capacity assurance • Response to Congressional inquiries 7
Use of BR in Supporting Regulatory Development Activities • Provides background information (e.g., universe of facilities, waste generation and management practices, etc.) for development of proposed and final rules. • Provides information to estimate economic impacts of rules • Baseline cost estimates • Change in costs as result of rule • Potential number of facilities affected • Potential change in behavior as result of rule 8
Use of BR in Supporting Regulatory Development Activities (cont.) Question: How likely is it that generators will change their waste management behavior and recycle their waste as a result of the Definition of Solid Waste (DSW) Rule? Answer: The following BR data supported EPA in answering this question: • Number of large quantity generators (GM Form) • Number of small quantity generators (WR Form) • Quantity of hazardous wastes generated by waste type (GM Form) • Waste management practices for waste types (GM Form) • -- recycling or other type • Form code: waste water or non-waste water (GM Form) • Source code: Production process, cleanup wastes, residual wastes, etc. (GM Form) • Distance to nearest recycling facility and waste management • facility (Computed using facility address from Site ID form.) • NAICS code (GM Form) 9
Use of BR in Supporting Regulatory Development Activities (cont.) • Other Data (Not BR): • Baseline costs of recycling and land disposal • Estimated costs of recycling with new rule • Outputs of Economic Analysis: • Estimated number of facilities shifting to recycling • Estimated volumes of waste recycled under new rule • Estimated cost savings 10
Use of BR in Supporting Targeting Opportunities Question: Are there hazardous waste generators who could recycle their wastes but instead are managing their waste differently? If so, how many? Who are they? Answer: The following BR data can be used to answer this question: • Number of large quantity generators, RCRA ID, and their location (Site ID Form) • Number of small quantity generators, RCRA ID, and their location (Site ID Form) • Quantity of solvent wastes generated by waste type for generators (GM) • Waste management practices by waste types for generators (GM) • -- recycling or non-recycling • Distance to nearest recycling facility and waste management • facility (Computed using facility address from Site ID form.) • NAICS code (GM Form) • Other Variables (Not BR): • Costs of recycling and land disposal (Estimated using above data) 11
Use of BR in Supporting Targeting Opportunities (cont.) • Outputs of targeting analysis: • Identification of HW generator clusters (as well as individual facilities) not recycling that could shift to recycling by: • RCRA ID, name and address • Industrial sector (NAICS code) • Volume of waste generated • Type of waste 12
Use of BR in Understanding Program Trends • Question: How is RCRA hazardous waste generation and management changing over time? What are the trends? • Answer: The following BR data can be used to answer this question: • Number of hazardous waste generators • Types of wastes generated • Volumes of wastes generated • Waste management practices • Number of waste streams generated per facility • Number of large quantity generators starting/stopping and staying in BR universe • Number of hazardous waste management facilities by type of management • Volumes of wastes by type generated by industrial sector • Combinations of the above 13
Bottom Line • BR represents important data/information source that you can use in support of your work • Try it, you’ll like it! 14
RCRA Targeting Goal Changes in Our Approach Making every inspection count Current Focus area Finding and Validating targets Information on the environment Risk Sensitive populations Environmental Impacts Our focus is on areas where there are multiple impacts to the community. “Make every inspection count”
RCRA Targeting Goal Changes in Our Approach Making every inspection count Current Focus area Finding and Validating targets Information on the environment Risk Sensitive populations Environmental Impacts Make the best use of resources: Agency databases and technology (GIS) Environmental data Coordination with internal and external stakeholders
RCRA Targeting Goal Changes in Our Approach Making every inspection count Current Focus area Finding and Validating targets Information on the environment Risk Sensitive populations Environmental Impacts Identify potential Environmental Justice communities with: Higher Risk Sensitive Populations Environmental Impacts
RCRA Targeting Goal Changes in Our Approach Making every inspection count Current Focus area Finding and Validating targets Information on the environment Risk Sensitive populations Environmental Impacts Plating Shops L. A. County Historically a source of significant environmental harm often resulting in enforcement cases, and cleanup actions.
RCRA Targeting Goal Changes in Our Approach Making every inspection count Current Focus area Finding and Validating targets Information on the environment Risk Sensitive populations Environmental Impacts BRS Dunn and Bradstreet RCRAInfo CERCLIS HWTS 623 potential metal finishing sites in L.A. County Review waste activity in HWTS. 245 active facilities (116 LQGs, 88 SQGs, 41 CESQG)
RCRA Targeting Goal Changes in Our Approach Making every inspection count Current Focus area Finding and Validating targets Information on the environment Risk Sensitive populations Environmental Impacts • NATA Cancer Risk • RSEI Modeled Hazard TRI • Mixed Use Residential/Industrial
RCRA Targeting Goal Changes in Our Approach Making every inspection count Current Focus area Finding and Validating targets Information on the environment Risk Sensitive populations Environmental Impacts • Under the Age of 18 • Low Birth Weight • Poverty
RCRA Targeting Goal Changes in Our Approach Making every inspection count Current Focus area Finding and Validating targets Information on the environment Risk Sensitive populations Environmental Impacts • Impaired Water Bodies • Plating Shop Clean Ups
Risk Areas With Combined Risk Census tracts where the top quartiles of RSEI modeled hazard and NATA cancer risk intersect
Sensitive Populations Areas With Combined Sensitive Populations Census tracts where the top quartiles of poverty, population under 18, and low birth weight intersect
Environmental Impacts Areas Near Metal Impaired Water Bodies Census tracts within 1 mile of a metal impaired water body
Combined Data Sets Areas With Combined Environmental Impacts Census tracts where top quartiles of risk, sensitive populations, and environmental impacts intersect
Active Facilities Cleaned Up Facility Data Set Dark blue 116LQG, light blue 88 SQG, red 9 LQG and 5 SQG in CERCLIS, and white EPA inspections 245 total active platers
Final Analysis All Data Sets Combined Pacoima/Sun Valley area Three focus areas identified: Information on facilities is used to identify focus areas Vernon area Compton/Gardena area
Lessons Learned • This was an effective targeting approach which could be applied to other sectors. • In order for the data to be useful, it needs to be turned into information. • RCRAInfo is a staring point for analysis. And no one data source should be relied upon solely.
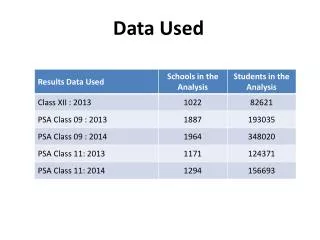
2010 RCRA Targeting • 2000 U.S. Census data • percent minority • per capita income • percent population <18 • percent population >64 • percent population without high school diploma • percent households with linguistic isolation
How Do We Use RCRAInfo? That’s easy! I use it to help manage the Permitting and Corrective Action Branch… but RCRAInfo National Conference 33 33
How Do We Use RCRAInfo? I’m not alone in NC… RCRAInfo National Conference 34 34
How Do We Use RCRAInfo? There’s the people in my Branch… but RCRAInfo National Conference 35 35
How Do We Use RCRAInfo? There are other Branches… and other management … and other needs. RCRAInfo National Conference 36 36
How Do We Use RCRAInfo? And what about the Division and the Department??? Bud RCRAInfo National Conference 37 37
How Do We Use RCRAInfo? The real question is Who in NC Uses RCRAInfo? RCRAInfo National Conference 38 38
How Do We Use RCRAInfo? • Management • Front Line Employees • Branches • Compliance Branch • Programs Branch • Facility Management Branch • Division of Waste Management • Department of Environment and Natural Resources RCRAInfo National Conference 39 39
How Do We Use RCRAInfo? • Facility Management Branch – Permitting and Corrective Action • Front Line Employees • Management RCRAInfo National Conference 40 40
How Do We Use RCRAInfo? • Compliance Branch – Inspections and NOVs • Front Line Employees • Management RCRAInfo National Conference 41 41
How Do We Use RCRAInfo? • Programs Branch – Orders, Fees, BR, Rules • Front Line Employees • Management RCRAInfo National Conference 42 42
How Do We Use RCRAInfo? • Division of Waste Management • Department EHNR RCRAInfo National Conference 43 43
Workplan Commitments • Universe determination at beginning of fiscal year • Tracking inspections (evaluations) • Monitoring enforcement actions/return to compliance • GPRA Goals • Permit/Renewal Universe • Corrective Action 45
Facility Contact • Acknowledgement Letters for new/updated notifications • Biennial Report • Who is currently LQG/TSD? • Tracking log for submittals • Fees Invoicing based on facility status 46
District Pilot Project • In 1997, Georgia implemented pilot for RCRA generator compliance activities in existing Coastal District office. • 1 FTE activities spread among as many as 6 compliance officers • OSHA & RCRA Inspector Training • 3 years of intensive State HQ oversight • Management recognized minimal results vs HQ staff • Proven with quarterly graphs over several years • RCRA generator inspection activities removed from District in FY 2009 – FTE returned to HQ 47