Download
1 / 12
120 likes | 123 Views
Learn how to find the vertex, or intersection point, of two lines using the algebraic method. Examples and step-by-step instructions provided.

E N D
Chapter 1 Section 3 Intersection Point of a Pair of Lines Read pages 18 – 21 Look at all the Examples
Note: • Authors present one method of finding point of the intersection of two lines. • There are other algebraic methods that you can use to find the point, so use the algebraic method that you are most comfortable with!
Vertex • A vertex is a point formed by the intersection of two lines. • Plural form: Vertices
Authors Method of Finding a Vertex • Convert each of the two linear equations into standard form • Equate the two expressions that are to the right of each ‘y =‘ • Solve for x • Solve for y, by substituting the value of x that you have found into one of the original equations (it doesn’t matter which one). • The point ( x , y ) is the vertex of the two lines.
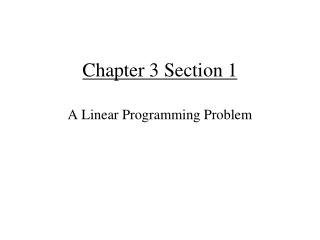
Exercise 21 (page 22) • Graph and find the vertices of the feasible set formed by the given system of inequalities: • Solution: Givenx and y intercepts 4 x + y> 8 y> – 4 x + 8 ( 2 , 0 ) , ( 0 , 8 ) x + y> 5 y> – x + 5 ( 5 , 0 ) , ( 0 , 5 ) x + 3 y> 9 y> – 1/3 x + 3 ( 9 , 0 ) , ( 0 , 3 ) x> 0 x> 0 y> 0 y> 0
Exercise 21 Graph x = 0 Not to scale I ( 0 , 8 ) Feasible Set II III IV ( 0 , 5 ) ( 9 , 0 ) y = 0 ( 0 , 3 ) ( 2 , 0 ) ( 5 ,0 ) y = – (1/3) x + 3 y = – x + 5 y = – 4 x + 8
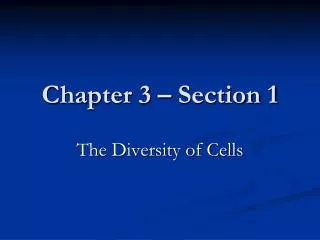
Exercise 21 Graph II x = 0 I Feasible Set y = – 4 x + 8 II y = – x + 5 III y = – (1/3) x + 3 IV y = 0
Vertex I x = 0 y = – 4 x + 8 y = – 4 ( 0 ) + 8 = 8 Vertex I : ( 0 , 8 ) Vertex II y = – 4 x + 8 y = – x + 5 – 4 x + 8 = – x + 5 – 3 x = – 3 x = 1 y = – ( 1 ) + 5 = 4 Vertex II : ( 1 , 4 ) Exercise 21: Find the Vertices
Vertex III y = – x + 5 y = – 1/3 x + 3 – x + 5 = – 1/3 x + 3 – 2/3 x = – 2 x = 3 y = – ( 3 ) + 5 = 2 Vertex III : ( 3 , 2 ) Vertex IV y = – 1/3 x + 3 y = 0 0 = – 1/3 x + 3 x = 9 Vertex IV : ( 9 , 0 ) Exercise 21: Find the Vertices
Supply vs Demand Application • Exercise 25 (page 23) Supply Curve: p = 0.0001 q + 0.05 Demand Curve: p = – 0.001 q + 32.5 Determine the quantity that will be produced and the selling price. Solution: q represent the quantity produced p represent the selling price (in dollars) 0.0001 q + 0.05 = – 0.001 q + 32.5 0.0011 q = 32.45 q = 29,500 which rep p = 0.0001 (29500) + 0.05 = 3 ( $3.00 , 29,500)
Solution continued 0.0001 q + 0.05 = – 0.001 q + 32.5 0.0011 q = 32.45 q = 29,500 29,500 units Now take one of the equation and substitute 29,500 in for q p = 0.0001 q + 0.05 p = 0.0001 (29,500) + 0.05 p = 3 $3.00
Answer • Twenty-nine thousand five hundred units are produced that sell for $3.00 per unit.