Download
1 / 12
130 likes | 299 Views
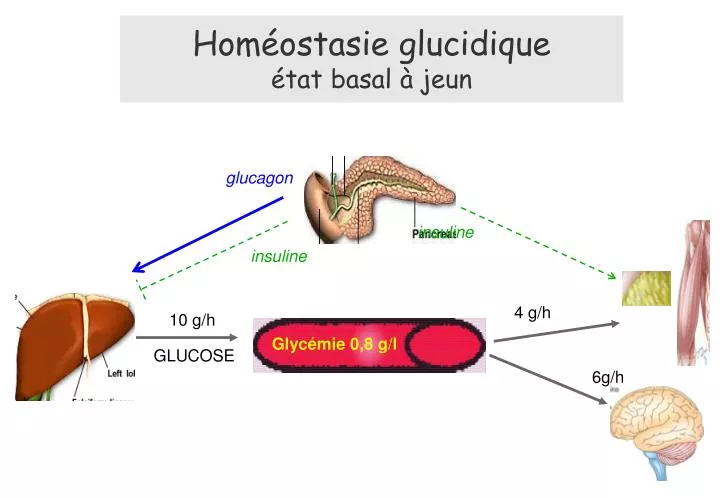
Homéostasie glucidique état basal à jeun. glucagon. insuline. insuline. 4 g/h. 10 g/h. Glycémie 0,8 g/l. GLUCOSE. 6g/h. glucagon. insuline. insuline. 44 g/h. 0 g/h. 6g/h. Homéostasie glucidique après les répas. Glycémie 1,3 g/l. GLUCOSE. 50 g/h. 350. 300. 250. 200. 150. 100.

E N D
Homéostasie glucidiqueétat basal à jeun glucagon insuline insuline 4 g/h 10 g/h Glycémie 0,8 g/l GLUCOSE 6g/h
glucagon insuline insuline 44 g/h 0 g/h 6g/h Homéostasie glucidiqueaprès les répas Glycémie 1,3 g/l GLUCOSE 50 g/h
350 300 250 200 150 100 n = 11 (m ± SEM) breakfast lunch dinner GLUCOSE, INSULIN AND GLUCAGON PROFILES FOLLOWING MEALS 11 10 9 8 GLUCOSE (mM) 7 6 5 4 0 3 6 9 12 15 700 600 500 400 INSULIN (pM) 300 200 100 0 0 3 6 9 12 15 GLUCAGON (ng/l) Velho et al., JCI 98:1755-1761, 1996 0 3 6 9 12 15 TIME (hours)
glucagon insuline insuline 44 g/h 0 g/h 6g/h Homéostasie glucidiqueaprès les répas Glycémie 1,3 g/l GLUCOSE 50 g/h
Homéostasie glucidiqueétat basal à jeun glucagon insuline insuline 4 g/h 10 g/h Glycémie 0,8 g/l GLUCOSE 6g/h
Diabète de type 2 état basal à jeun glucagon insuline insuline 4 g/h 20 g/h Glycémie 1,6 g/l GLUCOSE 6g/h
glucagon insuline insuline 44 g/h 0 g/h 6g/h Homéostasie glucidiqueaprès les répas Glycémie 1,3 g/l GLUCOSE 50 g/h
6g/h glycosurie Diabète de type 2glycémie post-prandiale glucagon insuline insuline 20 g/h 10 g/h Glycémie 2,4 g/l GLUCOSE 50 g/h
MODY2 (n = 7) controls (n = 11) (m ± SEM) n = 11 (m ± SEM) breakfast lunch dinner GLUCOSE, INSULIN AND GLUCAGON PROFILES FOLLOWING MEALS Velho et al., JCI 98:1755-1761, 1996 TIME (hours)