Download
1 / 35
420 likes | 621 Views
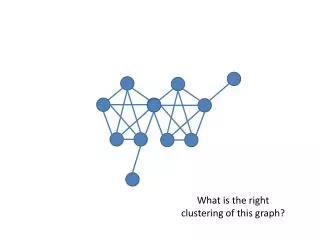
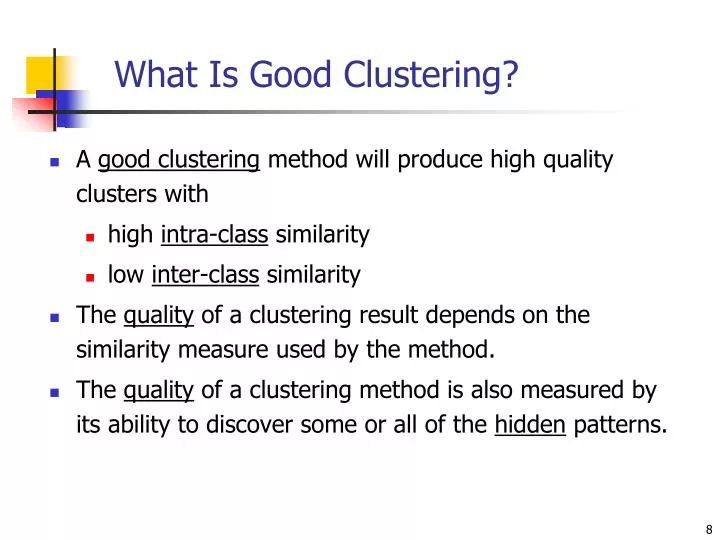
What Is Good Clustering?. A good clustering method will produce high quality clusters with high intra-class similarity low inter-class similarity The quality of a clustering result depends on the similarity measure used by the method.

E N D
What Is Good Clustering? • A good clustering method will produce high quality clusters with • high intra-class similarity • low inter-class similarity • The quality of a clustering result depends on the similarity measure used by the method. • The quality of a clustering method is also measured by its ability to discover some or all of the hidden patterns.
Vocabulary of Clustering • Records, data points, samples, items, objects, patterns… • Attributes, features, variables… • Similarity, dissimilarity, distances. • Centre, Centroid, Prototype. • Hard Clustering (Crisp Clustering)
Requirements of Clustering • Scalability • Ability to deal with different types of attributes • Discovery of clusters with arbitrary shape • Minimal requirements for domain knowledge to determine input parameters • Able to deal with noise and outliers • Insensitive to order of input records • Insensitive to the initial conditions • High dimensionality
Data Representation • Data matrix (two mode) • N objects with p attributes • Dissimilarity matrix (one mode) • d(i,j) : dissimilarity between i and j • with p attributes
Types of Clusters: Well-Separated • Well-separated clusters • A cluster is a set of points such that any point in a cluster is closer (or more similar) to every other point in the cluster than to any point not in the cluster 3 well-separated clusters
Types of Clusters: Center-Based • Center-based • A cluster is a set of objects such that an object in a cluster is closer (more similar) to the “center” of a cluster, than to the center of any other cluster • The center of a cluster is often a centroid, the average of all the points in the cluster, or a medoid, the most “representative” point of a cluster 4 center-based clusters
Types of Clusters: Contiguity-Based • Contiguous Cluster (Nearest neighbor or Transitive) • A cluster is a set of points such that a point in a cluster is closer (or more similar) to one or more other points in the cluster than to any point not in the cluster. 8 contiguous clusters
Types of Clusters: Density-Based • Density-based • A cluster is a dense region of points, which is separated by low-density regions, from other regions of high density. • Used when the clusters are irregular or intertwined, and when noise and outliers are present. 6 density-based clusters
Types of Clusters: Conceptual Clusters • Shared Property or Conceptual Clusters • Finds clusters that share some common property or represent a particular concept. 2 Overlapping Circles
Types of Clusters: Objective Function • Clusters Defined by an Objective Function • Finds clusters that minimize or maximize an objective function. • Enumerate all possible ways of dividing the points into clusters and evaluate the `goodness' of each potential set of clusters by using the given objective function.
Frequency Table November 9, 2014 25
Frequency Table November 9, 2014 26
Frequency Table November 9, 2014 27
Type of data in clustering analysis • Binary variables • Nominal variables • Ordinal variables • Interval-scaled variables • Ratio variables • Variables of mixed types
Binary variables The binary variable is symmetric (Simple match coefficient) The binary variable is asymmetric (Jaccard coefficient) Object j Object i November 9, 2014 29
Binary variables November 9, 2014 30
Dissimilarity between Binary Variables Example gender is a symmetric attribute the remaining attributes are asymmetric binary let the values Y and P be set to 1, and the value N be set to 0 November 9, 2014 31
Nominal Variables A generalization of the binary variable in that it can take more than 2 states, e.g., red, yellow, blue, green Method 1: Simple matching m: # of matches, p: total # of variables Method 2: use a large number of binary variables creating a new binary variable for each of the M nominal states November 9, 2014 32
Nominal Variables Examples Eye Color Days of the week Religion Seasons Job title November 9, 2014 33
Nominal Variables • Find the Proximity Matrix? November 9, 2014 34
Ordinal Variables Order is important, e.g., rank Can be treated like interval-scaled replacing xif by their rank map the range of each variable onto [0, 1] by replacing i-th object in the f-th variable by compute the dissimilarity using methods for interval-scaled variables November 9, 2014 35
Ordinal Variables • Find the Proximity Matrix? November 9, 2014 36
Interval-valued variables Examples Temperature Weight Time Age Length November 9, 2014 37
Interval-valued variables Standardize data Calculate the mean absolute deviation: where Calculate the standardized measurement (z-score) Using mean absolute deviation is more robust than using standard deviation November 9, 2014 38
Ratio-Scaled Variables Ratio-scaled variable: a positive measurement on a nonlinear scale, approximately at exponential scale, such as AeBt or Ae-Bt Methods: treat them like interval-scaled variables — not a good choice! (why?) apply logarithmic transformation yif = log(xif) treat them as continuous ordinal data treat their rank as interval-scaled. November 9, 2014 39
Ratio-Scaled Variables • Find the Proximity Matrix? November 9, 2014 40
Variables of Mixed Types • A database may contain all the six types of variables • symmetric binary, asymmetric binary, nominal, ordinal, interval and ratio. • One may use a weighted formula to combine their effects. • f is binary or nominal: dij(f) = 0 if xif = xjf , or dij(f) = 1 o.w. • f is interval-based: use the normalized distance • f is ordinal or ratio-scaled • compute ranks rif and • and treat zif as interval-scaled
Variables of Mixed Types • Find the Proximity Matrix? November 9, 2014 42