Download
1 / 22
230 likes | 351 Views
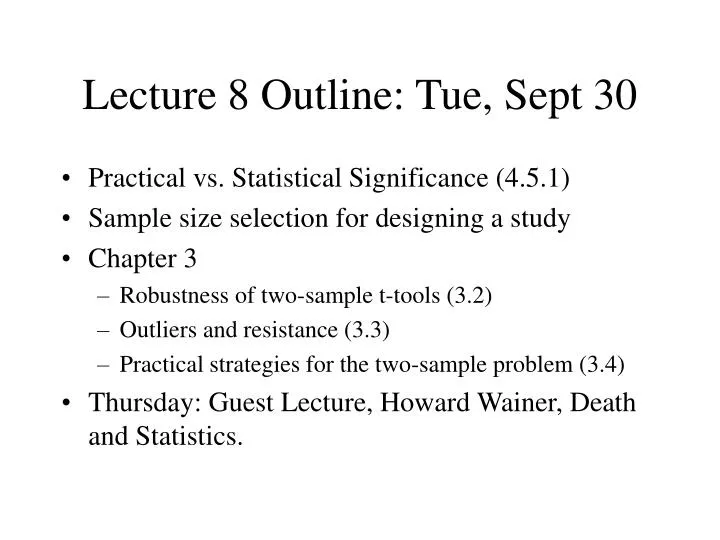
Lecture 8 Outline: Tue, Sept 30. Practical vs. Statistical Significance (4.5.1) Sample size selection for designing a study Chapter 3 Robustness of two-sample t-tools (3.2) Outliers and resistance (3.3) Practical strategies for the two-sample problem (3.4)

E N D
Lecture 8 Outline: Tue, Sept 30 • Practical vs. Statistical Significance (4.5.1) • Sample size selection for designing a study • Chapter 3 • Robustness of two-sample t-tools (3.2) • Outliers and resistance (3.3) • Practical strategies for the two-sample problem (3.4) • Thursday: Guest Lecture, Howard Wainer, Death and Statistics.
From 2-sided to right/left sided • Given a 2-sided p-value, how do we get a 1-sided p-value (JMP gives only the former)? • Right-sided (H0: , H1: ) • if : right-sided p-value = 2-sided p-value /2 (!!) • If : right-sided p-value > 0.5, so can’t reject …
Practical and Statistical Significance • Section 4.5.1 • p-values indicate statistical significance, the extent to which a null hypothesis is contradicted by data • This must be distinguished from practical significance, the practical importance of the finding.
Example • Investigators compare WISC vocabulary scores for big city and rural children. • They take a simple random sample of 2500 big city children and an independent simple random sample of 2500 rural children. • The big city children average 26 on the test and their SD is 10 points; the rural children average only 25 and their SD is 10 point • Two sample t-test: , p-value .00005 • Difference between big city children and rural children is highly significant, rural children are lagging behind in development of language skills and the investigators launch a crusade to pour money into rural schools.
Example Continued • Confidence interval for mean difference between rural and big city children: (0.43,1.28). • WISC test – 40 words child has to define. Two points given for correct definition, one for partially correct definition. • Likely value of mean difference between big city and rural children is about one partial understanding of a word out of forty. • Not a good basis for a crusade. Actually investigators have shown that there is almost no difference between big city and rural children on WISC vocabulary scale.
Practical vs. Statistical Significance • The p-value of a test depends on the sample size. With a large sample, even a small difference can be “statistically significant,” that is hard to explain by the luck of the draw. This doesn’t necessarily make it important. Conversely, an important difference may not be statistically significant if the sample is too small. • Always accompany p-values for tests of hypotheses with confidence intervals. Confidence intervals provide information about the likely magnitude of the difference and thus provide information about its practical importance.
Conclusions from a Study • A successful experiment has both statistical and practical significance. • Often the results of a study may be a summarized by a confidence interval on a key parameter (e.g., treatment effect) • Display 23.1 – four possible outcomes to a confidence interval procedure. • First three outcomes – A, B and C – are successes in that it is possible to draw an inferential conclusion that distinguishes between the important alternatives in one way or another. But outcome D is a failure because both the null hypothesis and practically significant alternatives remain plausible.
Designing a Study • Role of research design is to avoid outcome D. This is accomplished by making confidence interval short enough that it cannot simultaneously include both parameter values. • How to make confidence interval short enough (Display 23.2)? • Make s small through blocking, covariates, improved measurement (more later in course) • Choose large enough sample size.
Choosing the sample size • Suppose the null hypothesis is that in a matched pairs study. • Let PSD denote the practically significant alternative that is closest to zero. • A confidence interval for has margin of error . • We want the CI to have margin of error less than |PSD|. • Thus, we want the sample size n to satisfy • Solving for n gives that the sample size needs to be at least 4s2/PSD2. • Sample size calculation requires an estimate of (s) before conducting the study.
Example • Blood platelet aggregation before and after smoking cigarettes • The smallest medically significant difference is considered to be 1 platelet. The standard deviation of differences before and after smoking in the population is estimated to be 8. • How large a sample should be taken so that the confidence interval is not likely to contain both the null hypothesis that the difference is zero and a difference of 1 platelet?
Choosing Sample Size • Similar principles can be used to find appropriate sample sizes for two independent sample studies and randomized experiments
Closer Look at Assumptions • Chapter 3 • t-test and CIs based on the assumptions that • (i) the population distributions are normal • (ii) the population distributions have same S.D. • (iii) the sample observations are independent • These ideal assumptions, particularly (i) and (ii) are never met.
Case study 3.1.2: Effect of Agent Orange • Many Vietnam veterans are concerned that their health may have been affected by exposure to Agent Orange, a herbicide sprayed in South Vietnam between 1962 and 1970. • Particularly worrisome component of Agent Orange is a dioxin called TCDD which in high doses is known to be associated with certain cancers. • Nonrandom sample of 646 Vietnam vets and 97 non-Vietnam vets who entered Army between 1965 and 1971 and served only in U.S. or Germany, dioxin levels of both samples measured in 1987. • Question of interest: Are current (1987) dioxin levels higher in population of Vietnam vets?
Robustness of two-sample t-tools • A statistical procedure is robust to departures from a particular assumption if it is valid even when the assumption is not met exactly • Valid means that the uncertainty measures – the confidence levels and p-values – are nearly equal to the stated rules, e.g., a procedure for obtaining a 95% confidence interval is valid if it is roughly 95% successful in capturing the parameter • Statisticians know something about robustness from advanced theory and computer simulation.
How important is normality? • If the sample sizes are large, the t-tests will be valid no matter how nonnormal the populations are. • If the two populations have same S.D. and approximately the same shape and if , validity of t-tools is affected moderately by long-tailedness and very little by skewness. • See Display 3.4 • See Chapter 3.2 for how t-tools are affected by departures from normality and equal S.D. in other situations.
Departures from Independence • Independence: Knowledge of one observation can’t help to predict another. • Common violations of independence assumption: • Cluster effects (Y’s from same cluster, e.g., litters, are similar) • Serial effects (Y’s close together in time or space are similar) • Effect of lack of independence on validity of t-tools: . t-ratio no longer has a t-distribution and t-tools may give misleading results. • If cluster effects occur in pairs, use matched pairs t-test. • If we suspect other types of non-independence, use Ch. 9-15 tools.
Recognizing Matched Pairs Studies • Does there exist some natural relationship between the first pair of observations that makes it more appropriate to compare the first pair than the first observation in group 1 and the second observation in group 2? • Before and after designs • Example: A researcher for OSHA wants to see whether cutbacks in enforcement of safety regulations coincided with an increase in work related accidents. For 20 industrial plants, she has number of accidents in 1980 and 1995.
Outliers and resistance • Outliers are observations relatively far from their estimated means. • Outliers may arise either • (a) if the population distribution is long-tailed. • (b) they don’t belong to the population of interest (come from contaminating population) • A statistical procedure is resistant if one or a few outliers cannot have an undue influence on result.
Resistance • Illustration for understanding resistance: the sample mean is not resistant; the sample median is. • Sample: 9, 3, 5, 8, 100 • Mean with outlier: 25, without: 6.2 • Median with outlier: 8, without: 6.5 • t-tools are not resistant to outliers because they are based on sample means.
Practical two-sample strategy • Think about independence – use tools from later in course (or matched pairs) if there’s a potential problem • Use graphical displays to assess: normality, spread, outliers • If there are outliers, investigate them and see whether they (i) change conclusions; (ii) warrant removal. Follow the outlier examination strategy in Display 3.6.
Excluding Observations from Analysis in JMP for Investigating Outliers • Click on row you want to exclude. • Click on rows menu and then click exclude/unexclude. A red circle with a line through it will appear next to the excluded observation. • Multiple observations can be excluded. • To include an observation that was excluded back into the analysis, click on excluded row, click on rows menu and then click exclude/unexclude. The red circle next to observation should disappear.
Conceptual Question #6 • (a) What course of action would you propose for the statistical analysis if it was learned that Vietnam veteran #646 (the largest observation in Display 3.6) worked for several years, after Vietnam, handling herbicides with dioxin? • (b) What would you propose if this was learned instead for Vietnam veteran #645 (second largest observation)?