Download
1 / 20
200 likes | 383 Views
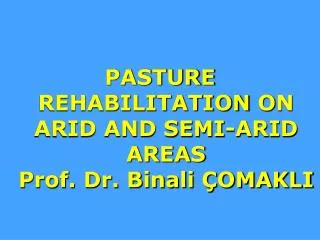
GLC mapping in semi-arid regions: a case study in West Africa. Jean-François Pekel and Pierre Defourny Department of Environmental Sciences and Land Use Planning - GEOMATICS UCL Université Catholique de Louvain BELGIUM In close collaboration with E. Bartholomé (JRC-SAI).

E N D
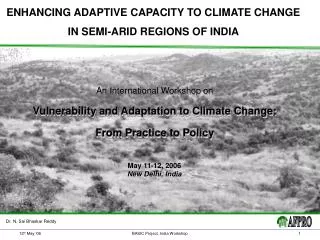
GLC mapping in semi-arid regions: a case study in West Africa Jean-François Pekel and Pierre Defourny Department of Environmental Sciences and Land Use Planning - GEOMATICS UCL Université Catholique de Louvain BELGIUM In close collaboration with E. Bartholomé (JRC-SAI) Supported by the Joint Research Center European Commision
Department of Environmental Sciences and Land Use Planning - UCLGLC 2000, 28 & 29 mars 2001 Objective : interpretation method design for the semi-arid region Data set :30 S1 images S10 images from 03/99 to 12/00 Study area
Department of Environmental Sciences and Land Use Planning - UCLGLC 2000, 28 & 29 mars 2001 • Initial statements for the method design • S10 products quality assessment : • S10 NDVI data are temporally consistent • thanks to the BRDF reduction effects and • the low impact of clouds in the MVC composite • S1 products quality assessment : • S1 multispectral data are spatially consistent • Regional seasonality allows to assume that the • beginning of the dry season provides the most • spatially constrasted image
Overall approach • Unsupervised classifications(ISODATA) based on • + the best cloud free S1 image(s) • 21/10/99 complemented by 22/10/99 • + 5 phenological variables either computed • - by pixel • - by classe • 3 methods • S1 interactive classes merging and labeling • S1 + pixel-based phenological variables • interactive classes merging and labeling • S1 classe-based phenological variables • interactive classes merging and labeling
Start Date = first date > NDVI min + 0.33 NDVI range • End Date = last date > NDVI min + 0.33 NDVI range • Veg. Duration = Date Veg. End - Date Veg. Start • NDVI range = NDVI max - NDVI min Department of Environmental Sciences and Land Use Planning - UCLGLC 2000, 28 & 29 mars 2001 5 phenological variables from S10 NDVI time series NDVI NDVI max = average of 3 highest NDVI values • NDVI min = average of 5 lowest NDVI values Time
Best S1 unsupervised classification • interactive merging into meaningful classes • classes labeling ISODATA Merging Labeling R, PIR, MIR LC map 16 classes ( 21/10/1999) Maps and high resolution images Department of Environmental Sciences and Land Use Planning - UCLGLC 2000, 28 & 29 mars 2001 30 classes
Best S1 classification 16 classes LC map Department of Environmental Sciences and Land Use Planning - UCLGLC 2000, 28 & 29 mars 2001
Class n° Decade NDVI 30 classes 70 NDVI Decades Department of Environmental Sciences and Land Use Planning - UCLGLC 2000, 28 & 29 mars 2001 • S1 classes merged automatically • according to per class average phenological variables • computed on the year-long S10 time series ISODATA 30 masks Phenological variables Mean profile per class Cl.nbr Min Range Dur.End ISODATA Labeling LC map 16 classes 4 ph.var.
S1 classes automatically merged 16 classes LC map Department of Environmental Sciences and Land Use Planning - UCLGLC 2000, 28 & 29 mars 2001
Step 1 NDVI Min NDVI Max NDVI Range If… Then Step 2 NDVI Min NDVI Range Maps and high resolution images Department of Environmental Sciences and Land Use Planning - UCLGLC 2000, 28 & 29 mars 2001 • S1+NDVI Min+NDVI range unsup. classification • interactive merging into meaningful classes • classes labeling NDVI max 3 highest NDVI Merging Labeling ISODATA 30 classes LC map 16 classes
S1 + ph. variables classification 16 classes LC map Department of Environmental Sciences and Land Use Planning - UCLGLC 2000, 28 & 29 mars 2001
S1 + ph. variables classification Best results (expert, computing) Best S1 classification S1 classes automatically merged More robust results (computing) water ! Most efficient results (expert) Department of Environmental Sciences and Land Use Planning - UCLGLC 2000, 28 & 29 mars 2001
LCCS use - definition of 16 classes from steppe to open forest ! ! ! Department of Environmental Sciences and Land Use Planning - UCLGLC 2000, 28 & 29 mars 2001 Tree density Crop area
Temporal evolution of NDVI NDVI « steppe arbustive » Time Department of Environmental Sciences and Land Use Planning - UCLGLC 2000, 28 & 29 mars 2001 Complementary information to classe name/code èaverage NDVI profile per classe
Department of Environmental Sciences and Land Use Planning - UCLGLC 2000, 28 & 29 mars 2001 • 3 additionnal issues : • year to year variation • agriculture density retrieval • method use for very large area
Department of Environmental Sciences and Land Use Planning - UCLGLC 2000, 28 & 29 mars 2001 Sensitivity of LC map to year to year variation NDVI Time
0,80 0,70 0,60 0,50 0,40 0,30 0,20 0,10 0,00 1 3 5 7 9 11 13 15 17 19 21 23 25 27 29 31 33 35 37 39 41 43 45 47 49 51 53 55 57 Department of Environmental Sciences and Land Use Planning - UCLGLC 2000, 28 & 29 mars 2001 Detection feasibility of the agriculture density NDVI Culture Grassland Shrubland Time 59 61 63 65 67 69 71 73 75 77 79 81 83 85 87
Procedure to apply the method to very large area è Indpt unsup. classification on moving window Department of Environmental Sciences and Land Use Planning - UCLGLC 2000, 28 & 29 mars 2001
Procedure to apply the method to very large area è Biomes stratification based on NDVI range Department of Environmental Sciences and Land Use Planning - UCLGLC 2000, 28 & 29 mars 2001
Department of Environmental Sciences and Land Use Planning - UCLGLC 2000, 28 & 29 mars 2001 Perspectives for GLC2000 data set C great information content C information extraction quite feasible New (?) issues because of the information quality : M classes merging becomes a more difficult exercise M classes labeling becomes a tuff exercise è need for labeling assistance through actual matching of classification output and reference information need for 1-km² ‘ field ’ observation method