1 / 1

4.0

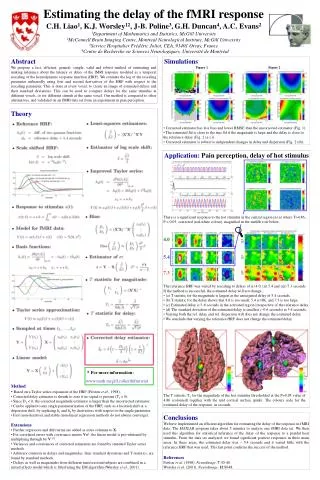
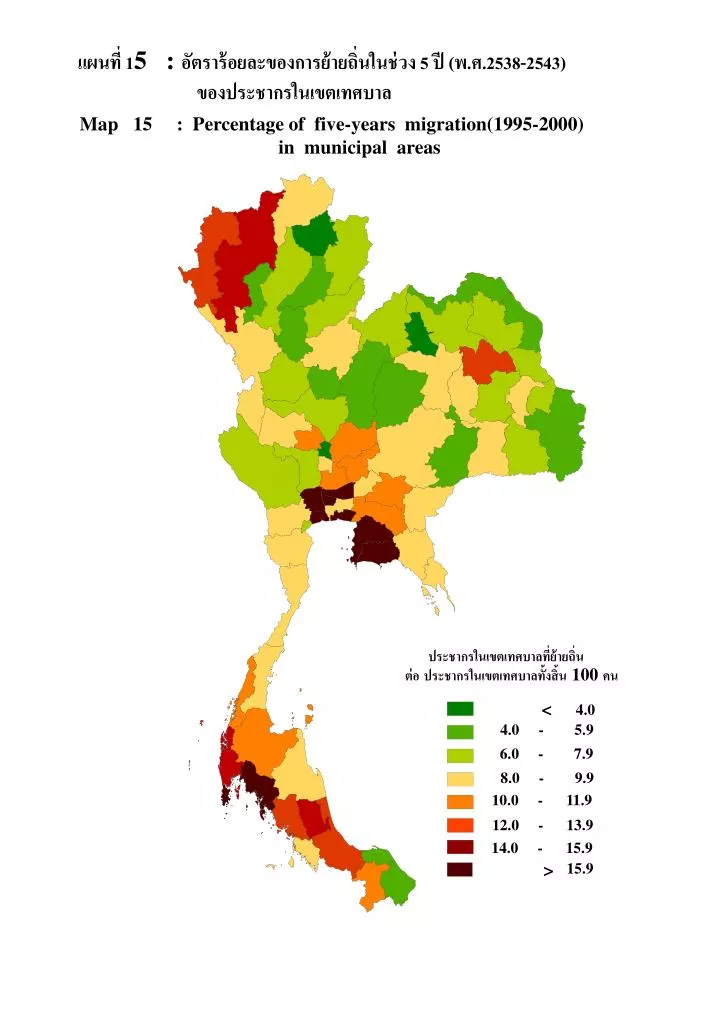
<. 4.0. 4.0 - 5.9. 6.0 - 7.9. 8.0 - 9.9. 10.0 - 11.9. 12.0 - 13.9. 14.0 - 15.9. 15.9. >. แผนที่ 1 5 : อัตราร้อยละของการย้ายถิ่นในช่วง 5 ปี (พ.ศ.2538-2543) ของประชากรในเขตเทศบาล.

Download Presentation

4.0

An Image/Link below is provided (as is) to download presentation Download Policy: Content on the Website is provided to you AS IS for your information and personal use and may not be sold / licensed / shared on other websites without getting consent from its author. Content is provided to you AS IS for your information and personal use only. Download presentation by click this link. While downloading, if for some reason you are not able to download a presentation, the publisher may have deleted the file from their server. During download, if you can't get a presentation, the file might be deleted by the publisher.

E N D

Presentation Transcript


  1. < 4.0 4.0 - 5.9 6.0 - 7.9 8.0 - 9.9 10.0 - 11.9 12.0 - 13.9 14.0 - 15.9 15.9 > แผนที่ 15 : อัตราร้อยละของการย้ายถิ่นในช่วง 5 ปี (พ.ศ.2538-2543) ของประชากรในเขตเทศบาล Map 15 : Percentage of five-years migration(1995-2000) in municipal areas ประชากรในเขตเทศบาลที่ย้ายถิ่น ต่อประชากรในเขตเทศบาลทั้งสิ้น 100 คน

More Related