Download
1 / 32
320 likes | 479 Views
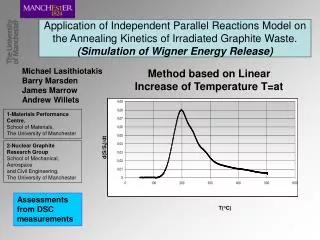
Application of Independent Parallel Reactions Model on the Annealing Kinetics of Irradiated Graphite Waste. (Simulation of Wigner Energy Release). Michael Lasithiotakis Barry Marsden James Marrow Andrew Willets. Method based on Linear Increase of Temperature T=at.

E N D
Application of Independent Parallel Reactions Model on the Annealing Kinetics of Irradiated Graphite Waste.(Simulation of Wigner Energy Release) Michael Lasithiotakis Barry Marsden James Marrow Andrew Willets Method based on Linear Increase of Temperature T=at 1-Materials Performance Centre, School of Materials, The University of Manchester 2-Nuclear Graphite Research Group School of Mechanical, Aerospace and Civil Engineering, The University of Manchester d(S/Sf)/dt Assessments from DSC measurements T(oC)
Why Waste Problem… Early UK graphite moderated research and production reactors operated at low temperatures, below 150°C. Future= Decommissioning-Production of 85000 ton intermediate level waste Where does Wigner Energy come from? Exothermic behavior Rapid increase of temperature Destruction of container Contamination (ground water) Oxidation of graphite Significant amounts of stored (Wigner) energy that may be relatively easily released characterization of graphite samples long term "safe-storage" Decommissioning issues reactor core dismantling graphite waste packaging final disposal of this irradiated graphite waste.
Nature of Problem….. Formation of defects Cascade Interstitial defects Vacancy defects Interstitial loops
Description of the behavior of the samples over a wide range of experimental conditions Chemical Kinetic Analysis and Thermal Characterization=Assessments on Speed of Reactions • Prediction of the behavior outside the domain of investigation • Characterization of samples and establishment of a deeper insight into the processes involved
Better understanding of radiation damage in graphite crystals Aim of Kinetic Analysis of Wigner Energy Release • Robust prediction of stored energy release particularly for new conditions such as decommissioning • Gaining an understanding of the characteristics of the annealing procedures-reactions • Correlation with microstructural analysis using techniques such as TEM and Raman • Proposed to test these various kinetic models against experimental data
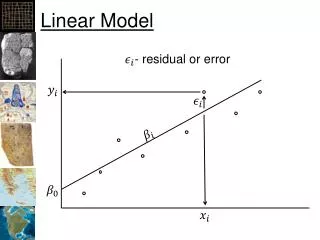
Basic Relation of kinetics in general Arrhenius Equation S=fraction of energy released T=temperature f(s)=mathematic interrelation to the S, k=factor of speed of reaction A=factor of Arrhenius or pre-exponential factor Ea=Activation Energy R=Universal Gas Constant =8,314 J/(mol.oK) The mathematic function f(S) that until today has been more frequently used, is f(S)=S. Via Logarithm or Y =a +b x Y =a +b x Extraction of a and b by the Least Squares Method a = lnA, b = -Ea / R A Ea
Activation Energy Ea H1 H ΔH H2 1 2
Previous researchers……. • Constant Activation Energy Model Activation energy remains constant over the temperature range of the release Simmons: 3 Models • General Model Activation Energy is a function of temperature • Constant Frequency / Variable Energy Model Type f(S)=S Nightingale: • γ (or n)=6-8 Type f(S)=Sγ
Historical Data Windscale piles JAERI JRR-2 experimental reactor Various Irradiation doses Various Heating rates
Extraction of A and Ea fromSimmons-Nightingale models Simmons Nightingale 6<γ<8 taking logarithms Y =a +bx Y =a +bx Extraction of a and b by the Least Squares Method a=lnA, b=-Ea/R Ea A
Effort to reproduce the experimental curve Type f (S) =S (Simmons) • Very poor results
Effort to reproduce the experimental curve Type f (S) =Sn (Nightingale) • Better results, but still not acceptable
InitialConclusions • One reaction isnot enoughto reproduce the experimental curve. • More than one reactions are needed. Possible Reasons: • Territories with different properties • Amorphous territories, • Crystalline territories, • Dislocations, different types of dislocations etc.). Composite material (The term “Graphite” is misleading.) => Different behaviour of each part. • Possibly,more than onecomponents • Impurities • Contamination by other elements, due to construction, and usage in the reactor core).
Model of Independent Parallel Reactions (Pseudo-reactions) Independent parallel reactions taking place without interactions with each other Total production of energy and rate of energy production for N overall reactions si=energy produced by the reaction i ci=percentage of contribution of reaction i to the overall energy production i=1,2,3, N Individual Components are supposed to react separately following the Arrhenius Equation (Iwata’s Idea) For n<>1 Nightingale For n=1 Simmons
Step 1st. Examining the DSC curve and isolating of peaks and shoulders
Assumption of the Dominant Reaction: • The only reaction taking place in this territory is one • particular reaction without • any contribution of the others. taking logarithms Solving for a particular territory (Least squares etc.) Y = a + b x a=lnA, b=-Ea/R
Step 2nd. Addition of partial reactions, in order to reconstruct the experimental DSC curve Application of Linear Regression model on values Ai, Ei, ci, ni Poor results Problem Solved
3 DIFFERENT MODELS Type f(S)=S (Simmons) 6 Reactions Type f(S)=Sn (Nightingale) 6 Reactions Type f(S)=Sn (Nightingale) 5 Reactions
IWATA 5 Rate of heating : 5oC/min Simmons model with 6 pseudo-reactions
B2-2L Nirex. Rate of heating : 10 oC/min Simmons with 6 pseudo-reactions.
IWATA 1 Rate of heating : 5oC/min f(S)=Sn (Nightingale) 6 Reactions.
NIREX B12-2L Rate of heating :10oC/min f(S)=Sn (Nightingale) 5 Reactions
IWATA 5. Rate of heating : 5oC/min. f(S)=Sn (Nightingale) 5 Reactions.
Lexa f. Rate of heating : 10oC/min. f(S)=Sn (Nightingale) 5 Reactions.
Type f(S)=Sn (Nightingale) 5 Reactions Results for Dev1 for all the experiments
Type f (S) =Sn (Nightingale) 5 Reactions Variation of values for all DSC experiments analyzed • n and c for the different DSC runs - more variation. • n generally increasing for the first two reactions and decreasing for the other three reactions, with increased irradiation fluence, as assessed from the LEXA model results. • 1st reaction • Stability of A and Ea are similar in all cases • n and c vary • c does not indicate the percentage of different types of defects on the overall defect population • c= part of their contribution to energy released • Some types of defects may not contributetheir full capacity • - • Different values of fluence • - • Change of Heating rate • A and E 2nd Reaction • More variation that first reaction • Activation energies are of the same order around 73 kJ/mol • A in the 3rd reaction • Variation between 5.34x10⁶ -8.39x10⁶ reaching 3,18x10⁷ (some of high rates) • - Iwata series, Ea around 75 kJ/mol between 65 - 85 • 5th reaction • Absent in the Iwata series • A value for A between 2.47x10⁵ or 2.88x10⁵ • Ea around 75 kJ/mol ranging between 70-90 • 4th reaction • Not required when modelling the Iwata series • A, value of 1.88x10⁶ in most cases • A mainly around 5.07x10⁵ for the LEXA f and LEXA g specimens.
Conclusions Independent parallel reactions model • Good predictions of the kinetics • Variation of values within appropriate limits • Relative stability of assessed values has been achieved
Acknowledgements. • Greek State Scholarships Foundation • Materials Performance Centre • Dr Steve Preston – (Former Nirex)
1-Satisfactory results. Dev1<3%. 2-Application of one calculated model to other experimental data, for verification. 3-Choice of the simplest model. 4-Results between different experiments may vary slightly. 5-Conditions of experiment, play a vital role in the variation of values. 6-The shape of the calculated curve must follow the experimental. 7-Experience in choosing peaks and shoulders. RULES and PARAMETERS for ACHIEVING REALISTIC INTERPRETATIONS
Optimization of parameters dev(1) and dev(2) Z= total number of measurements N= number of parameters used, i.e. A, c and possibly n Dev 1 Divergence between calculated and experimental derivatives expressed in percentage, associating the biggest rate of reaction that is observed in experimental DSC curve Dev 2 Divergence between the experimental and calculated values of Sf