Download
1 / 35
350 likes | 442 Views
A New World for Mapping. John Spencer Spatial Analysis Unit October 5, 2009. Wish you were here!!!. Everything happens somewhere. Data. Where?. Why?. ESRI is the market leader. Three shelves of ESRI manuals and third party materials. Two types of software:. Geo-display

E N D
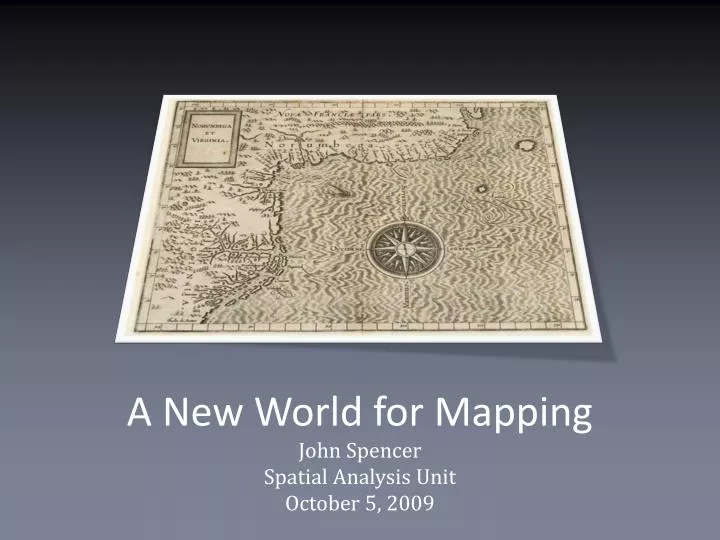
A New World for Mapping John Spencer Spatial Analysis Unit October 5, 2009
Wish you were here!!! Everything happens somewhere
Two types of software: Geo-display Geographic Information System
Geo-display Displays data geographically Suitable for basic maps
E2G MEASURE Evaluation’s program for mapping Excel data
E2G • Displays excel data • Free • Easy to use • Maps can be easily shared • Not every country is available • Requires internet connection • Data structure requirements
Dev-Info UN Millenium Development Goals based software
Dev-Info Advantages • Free • Own web site, documentation, and online support group. • Ability to map and graph data and save files to several common formats. • Ability to adapt to use with other databases and shapefiles (map boundary files) with many input and output formats allowed. • Available in 6 different languages.
Dev-Info Disadvantages • Developed specifically to work with UNICEF’s data formats and conform to their “Millenium Development Goals”. • Difficult learning curve when it comes to customizing with own data. • Limited capablilty to import from other formats.
GIS Analyzes data in layers Suitable for basic or advanced maps, spatial analysis
Healthmapper Free mapping program from World Health Organization
Healthmapper Advantages • Can perform some GIS functions • simple geographic data analysis and display. • Free • Wide user base • Good documentation
Healthmapper Disadvantages • Limited control of types of data classification and editing of shapefiles • Moderate learning curve. • Limited output formats for both maps and graphs
DIVA GIS Open source GIS program
Diva GIS Advantages • Free • Common input types (shapefile, text file, dBase, MS Access) allowed. • Some flexibility as to color selection and number of classes for data.
Diva GIS Disadvantages • Clunky interface • Moderate learning curve. • Output is a bitmapped image. • Label placement and other map element placement extremely limited. • Must have own map files or coordinate files already linked to data. • Only one method of data classification (quartiles) available.
Summary • Many new options • Best option is dependent on goals • Possible to experiment and use multiple programs, if needed