Download
1 / 14
140 likes | 258 Views
2. x. ECONOMETRICS. x. CHAPTER. x. x. x. THE MEANING OF REGRESSION. Dependent variable. Independent variables. explained by. Price of iTune. Quantity of iTunes demanded. Consumer income. Price of CD. 6. 5. 4. Quantity (100s). 3. 2. 1. .2. .4. .6. .8. 1. 1.2. Price ($).

E N D
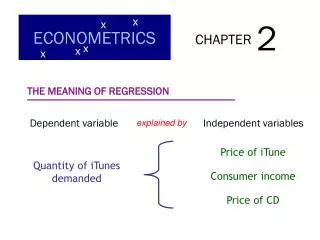
2 x ECONOMETRICS x CHAPTER x x x THE MEANING OF REGRESSION Dependent variable Independent variables explained by Price of iTune Quantity of iTunes demanded Consumer income Price of CD
6 5 4 Quantity (100s) 3 2 1 .2 .4 .6 .8 1 1.2 Price ($) X1 Price of iTune Y Quantity of iTunes demanded X2 Consumer income X3 Price of CD Y = b1 + b2 X
6 5 4 Quantity (100s) 3 2 1 .2 .4 .6 .8 1 1.2 Price ($) E(Y)= b1 + b2 X E(Y)= 550 - 250 X Yi= b1 + b2Xi + ei Xi Yi E(Yi) ei 0.2 0.4 0.6 1.0
Data analysis A B C 1 -0.23002 Random Number Generation 2 0.389811 Number of variables OK 3 0.211674 Cancel No. of Random No. 4 1.31909 Help Distribution 5 0.785948 Mean = 6 0.017634 Stnd deviation = 7 -1.3149 8 -1.32496 Random Seed: 9 Output range: 10 11 Tools 0 1 $A$1:$A$8
fx 49 -3 50 -2 51 0 -1 52 4 0 53 0 7 1 54 4 13 2 55 7 19 3 56 13 7 57 -2 -1 0 1 2 19 0 58 7 59 0 -1.3149 Ctrl Shift Enter -1.32496
fx -3 -2 52 0 0.023 -1 53 Function Arguments 4 0.159 0 54 NORMDIST 7 0.500 1 55 X 13 0.841 2 56 Mean 19 0.977 3 57 Stnd_dev 7 0.999 58 Cumulative 0 59 OK Cancel Formula result = Cumulative Cum Norm 0.001 A53 0 1 TRUE
Population Regression Function (PRF) Yi= B1 + B2 Xi + ui • the way the world works • but we can’t observe this directly Sample Regression Function (SRF) Yi= b1 + b2 Xi + ei • an estimate of the PRF based on a sample • ordinary least squares (OLS) is method used
E(Yi ) = Yi= b1 + b2 Xi ei= Yi– Yi ∑ ei2= ∑ (Yi – Yi )2 Ordinary Least Squares (OLS) OLS minimizes: The residual sum of squares (RSS)
∑ Yi Y= n b2 = ∑ (Xi – X)(Yi– Y) ∑ (Xi – X)2 b1 = Y - b2 X
6 5 b2 = 4 Quantity (100s) 3 ∑ (Xi – X)(Yi– Y) 2 1 .2 .4 .6 .8 1 1.2 ∑ (Xi – X)2 b1 = Y - b2 X Price ($)
Xi Yi E(Yi) ei 0.2 490 500 -10 0.4 505 450 55 0.6 336 400 -64 1.0 318 300 18 ei2 100 3,025 4,096 324 ∑ei2 7,545
VAR0001 VAR0002 var 1 0.2 490 Linear Regression 2 0.4 505 Dependent Statistics VAR0001 3 0.6 336 VAR0002 Plots 4 1.0 318 Previous Next Save 5 1.2 249 Independent(s) Options 6 Method: Enter ▼ OK Reset Cancel Help Analyze Regression Linear
Model Unstandardized Coeffic Stndardzd Coeffic t Sig. B Std. Error Beta 1 (Constant) X1 549.837 -250.349 46.833 60.461 -.923 11.740 -4.141 .001 .026 Xi ei 0.2 -10 0.4 55 0.6 -64 1.0 18 1.2 -1 E(Y) = 550 − 250 X The residuals are uncorrelated with the independent variable.
fx A B C 1 0.2 -10 2 0.4 55 3 0.6 -64 Function Arguments 4 1.0 18 CORREL 5 1.2 -1 Array1 6 Array2 7 OK Cancel Formula result = A1:A5 B1:B5


