Download
1 / 33
330 likes | 497 Views
Transit’s Role in Creating Livable Communities. Presentation by Eva Lerner-Lam, President The Palisades Consulting Group Virginia Transit Association Annual Meeting June 7, 2001. Overview. How did we get here? Finding our “voice” in the 1990’s

E N D
Transit’s Role in Creating Livable Communities Presentation by Eva Lerner-Lam, PresidentThe Palisades Consulting GroupVirginia Transit Association Annual Meeting June 7, 2001
Overview • How did we get here? • Finding our “voice” in the 1990’s • Learning the importance of transit and how to leverage it • Tools for integrating transit and land use • Glimpses of what can be • Need to keep closing the gap between transit and land use planners
A Half Century of Auto-Oriented Development… Many reasons: • Federal “motorization- industrialization” policy • VA housing programs targeting the suburbs • Extended peacetime economic growth and prosperity
…resulted in unintended “sprawl” Effects of sprawl: • Wasted resources • Environmental impacts • Societal stress
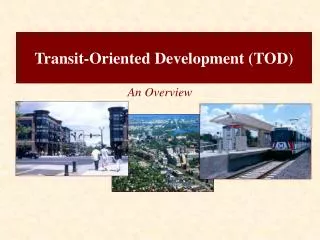
1990’s: A New Paradigm Emerges Many manifestations: • Smart Growth • Sustainable Development • Traditional Neighborhood Design • Transit-Oriented Development • Infill Development • Transit Villages • Access Management
Transit’s Role in the New Paradigm Holtzclaw Index: “One additional passenger-mile on transit results in reductions in driving substantially greater than one mile.”
Transit Access Impacts on VMT Community San Francisco Walnut Creek San Ramon Pop Density/pop acre 24.2 4.6 2.4 Net HH density/hh res ac 48.3 4.7 3.2 Transit Accessibility 70 21 1.0 Shopping Accessibility .76 .10 .00 VMT Capita 4,779 9,618 10591 Victoria Transport
Design Feature Reduced Vehicle Travel Residential development around transit centers. 10% Commercial development around transit centers. 15% Residential development along transit corridor. 5% Commercial development along transit corridor. 7% Residential mixed-use development around transit centers. 15% Commercial mixed-use development around transit centers. 20% Residential mixed-use development along transit corridors. 7% Commercial mixed-use development along transit corridors. 10% Residential mixed-use development. 5% Commercial mixed-use development. 7% Reductions in Per Capita Motor Vehicle Travel (Dagang, 1995)
Transit Access Saves Consumers’ Money • Households in auto-dependent regions devote more than 20% of household expenditures to surface transport ($8,500/year) vs. less than 17% ($5,500/year) in those with transit access (McCann 2000)
Synergies Among Methods • Increasing land use density, pedestrian and bicycle improvements, transit-oriented development, more mixed land use and parking management can reduce per capita auto use by 15-25%
Let’s Talk Transit Anton Nelessen: • Design by Democracy • Pedestrian Precincts • Neighborhood Transit Photo courtesy Farr Associates
Leveraging the Power of Transit • Andres Duany: “Houses and businesses should be assembled into a neighborhood and a regional structure that supports transit…and vice versa.”
“Mind the Gap”—between Land Use and Transit Planning Bill Lieberman: “A lot of the sprawl we have today is because people planning transit facilities and people planning land use haven’t been put together.” Diagrams Courtesy of Walter Kulash Glatting Jackson Kercher Anglin Lopez Rinehart
Transit Toolkits for Smart Growth* • Access management ordinances • Bike/Transit integration • Carsharing/Vehicle rentals • Commuter Financial Incentives • Congestion Pricing • Distance-based Fees • Guaranteed Ride Home Programs • High Occupant Vehicle Preference • Level of Service Standards *These examples are from Northern VA Transportation Coordinating Council’s Task Force on LU and Transportation ATLAS Study
Transit Tools for Smart Growth (continued) • Parking Management/Restrictions • Parking Pricing • Suburban Scale Transit • Telework Centers/Initiatives • Traffic Calming • TDM Programs • Transportation Management Associations • Trip Reduction Ordinances • Vehicles Use Restrictions
Transit Tools for Smart Growth (continued) Still need: • Formalization of concept and lexicon • Design manual for transit access improvements • Zoning code changes (e.g., TND Ordinance) • Institutional integration
A 21st Century “String of Pearls” (and “Popcorn”) Calthorpe: Took the “string of pearls” from the 1800’s and started building today’s “pedestrian pockets” around rail stations (Duany: Add “popcorn” for circulator bus feeder stations)
A Hierarchy of Transit Planning • Regional Transit Corridors • Town Centers • Neighborhoods
A Region’s Transit Corridors • Town Centers connected to Urban Centers by transit as well as by auto San Jose shopping mall Photo courtesy of Michael Corbett
The Town Center • Seaside, FL broke new ground and laid the foundations for what was to become “New Urbanism.” • Although a resort town, it inspired many to think differently about suburban design. Photo courtesy of DPZ
The Town Center • In a transit-friendly region, neighborhood centers are connected to town centers at transit stops. Courtesy of Duany Plater-Zyberk & Company
The Town Center Gresham LRT Station, Portland, OR
Town Center, Before • The Crossings, a “dead” mall Photo courtesy Calthorpe Associates
Town Center, After • The Crossings, transformed • Parks are included in a system of pathways leading to a light-rail station. Photo courtesy Calthorpe & Associates
The Neighborhood • Duany Plater-Zyberk's standards for a new neighborhood are based upon Clarence Perry's 1929 diagrams (which described walkable neighborhoods such as Forest Hills, NY and Radburn, NJ)
The Neighborhood • Communities that are affordable, conducive to social interaction and within walking distance to transit Photo courtesy Local Government Commission
The Neighborhood All neighborhoods in Northwest Landing are within walking distance of transit stops Photo courtesy Calthorpe Associates
The Neighborhood • Northwest Landing, Palisade Village Photo courtesy Calthorpe Associates
The Neighborhood • Northwest Landing, single-family homes Photo courtesy Calthorpe Associates
The Neighborhood • Laguna West streetscape Photo courtesy Calthorpe Associates
The Neighborhood Richmond, CA Transit Village—a village built around a BART station
Moving Forward: “Minding the Gap” • Congress for the New Urbanism: http://www.cnu.org • American Planning Association: http://www.planning.org • Smart Growth Network http://www.smartgrowth.org • Surface Transportation Policy Project: http://www.transact.org • Urban Land Institute: http://www.uli.org Hiawatha/Lake Street TOD Minneapolis, MN Photo Courtesy Calthorpe Associates