Download
1 / 32
320 likes | 478 Views
The Value of Healthcare Information Exchange and Interoperability. Davis Bu, MD, MA Center for Information Technology Leadership Get Connected Knowledge Forum June 29, 2004. Overview . CITL overview Research methods & results Study limitations Take home points . CITL Overview.

E N D
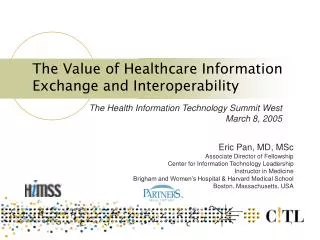
The Value of Healthcare Information Exchange and Interoperability Davis Bu, MD, MA Center for Information Technology Leadership Get Connected Knowledge Forum June 29, 2004
Overview • CITL overview • Research methods & results • Study limitations • Take home points
CITL Overview Center for Information Technology Leadership
Center for IT Leadership Mission • Produce timely, rigorous market-driven technology assessments which: • Help providers invest wisely • Help IT firms understand value proposition • Help shape public policy • Established at Partners HealthCare in partnership with HIMSS
CITL Research Team • Eric Pan, MD, MSc • Davis Bu, MD, MA • Julia Adler-Milstein, BA • David Kendrick, MD, MPH • Ellen Rosenblatt, BS • Jan Walker, RN, MBA • Blackford Middleton, MD, MPH, MSc • David Bates, MD, MSc • Doug Johnston, MA
CITL First Report: Ambulatory CPOE Value • Nationwide adoption of advanced Ambulatory CPOE systems would: • Eliminate more than 2 million Adverse Drug Events (ADEs) per year • Avoid more than 190,000 hospitalizations per year • Deliver $34 billion in net value per year to the US healthcare delivery system through reduced medication, radiology, laboratory, and ADE-related expenditures
Secondary (out of scope) HIEI Definition • Provider-centric encounter-based model of clinical information exchange • Clinical and administrative transactions and data exchange • Between providers and other providers • Between providers and labs, pharmacies, payers, radiology centers, and public health departments Public Health Other Provider Radiology Provider Pharmacy Payer Laboratory
Pharmacy Prescription Lab Order Order Imaging Center Results Results Remittance advice Referral Request Chart Request Eligibility, Disease Reports, Vital Statistics Referrals, CSI Claims attachments, Claims submission, Coordination of benefits Local Public Health Dept. Other Provider Payer Flow of Healthcare Information Clinical Encounter Diagnosis Treatment Claims and Billing Public Health
Healthcare Data Flow Clinical trials / biomedical studies Employer Research Institutions Enrollment Public Health Dept. Aggregate Encounter data Primary Care Group Administrator Aggregated claims Third Party Administrator or PBM Payment Capitation payments HMO Public Insurance & Health Care Prog. Aggregated billing Enrollment data Salary & Bonus Utilization Lab EOB / payment Aggregated billing EOB / payment Claim Encounter Report JCAHO Order DOC Results Drug Co.s Consumer satisfaction survey Pharmacy State Insurance Board Imaging Center Pick-up script Sales / Orders NCQA Pharmacy Wholesaler Other Public Agencies. e.g. INS, Soc. Svcs Co-payment Health Plan Brochure Enrollment & Eligibility
HIEI Taxonomy No PC/information technology Fax/Email Structured messages, non-standard content/data Structured messages, standardized content/data
Research Methods • Literature review • Reviewed studies from academic and general/trade literatures; over 600 citations reviewed • Market research • Expert panel • Day-long briefing and first assessments • Phone/email consultations • Expert review of literature findings • Estimates of HIEI impact • Critique of all projections and conclusions • Construction of cost-benefit model (influence diagram) • Includes 1,238 nodes
HIEI Expert Panelists • David J. Brailer, MD, PhD. • Senior Fellow, Health Technology Center. • William R. Braithwaite, MD, PhD, FACMI. • Independent Consultant. • Paul C. Carpenter, MD, FACE. • Associate Professor of Medicine, Divisions of Endocrinology-Metabolism and Health Informatics Research, Mayo Clinic, Rochester, MN. • Daniel J. Friedman, PhD. • Independent consultant. • Robert Miller, PhD. • Associate Professor of Health Economics in Residence, Institute for Health & Aging and Department of Social and Behavioral Sciences, UCSF. • Arnold Milstein, MD, MPH. • Medical Director, Pacific Business Group on Health. US Health Care Thought Leader, Mercer Human Resource Consulting. • J. Marc Overhage, MD, PhD, FACMI. • Investigator, Regenstrief Institute for Health Care. Associate Professor of Medicine, Indiana University School of Medicine. • Scott S. Young, MD, FAAFP. • Senior Clinical Advisor, Office of Clinical Standards and Quality, Centers for Medicare and Medicaid Services. • Kepa Zubeldia, MD. • President and CEO, Claredi Corporation.
HIEI Analytical Model • Model financial value with 3 perspectives: Public Health • Individual provider group or hospital Other Provider Radiology Provider 2) Stakeholder group Pharmacy Payer 3) National Laboratory
Key HIEI Model Assumptions • Level 1 is baseline – manual practices • Project the financial impact of cost reduction at Levels 2, 3, and 4 • Model payers at Level 4 only • Provider-centric • No secondary transactions considered • Encounter-centric • Clinical, administrative, and financial data related to clinical encounters • Financial value of information exchange and interoperability between entities • Not within entities
Public Health Other Provider Radiology Provider Pharmacy Payer Laboratory Principal Cost Model Components • For providers: • Number of interfaces • Interface costs • System costs • For stakeholders: • Number of interfaces • Interface costs
HIEI Cost Assumptions • Assumptions: • No cost for Levels 1 and 2 • Stakeholder and hospital interface cost at $50K/each. Clinician office interface cost at $20K/each • Providers purchase electronic medical records with interoperability functionality at Levels 3 and 4 • Cost for stakeholder systems not included • Rollout costs include initial system and interface costs • Include annual maintenance costs for systems and interfaces • Cost for standards development and maintenance not included • Payer costs derived from HIPAA Final Impact Analysis
Entity Interface Number of Interfaces Level 3 Level 4 Pharmacies Pharmacies Public Health Public Health Provider (Small Group Practice) Provider (Small Group Practice) Labs Labs Radiology Centers Radiology Centers Other Provider Other Provider
National Implementation Schedule • Assume a 10-year technology rollout and usage schedule • Ramp up the adoption of systems and interfaces over the first five years, with 20% adoption per year • Ramp up the benefit from technology over five years, beginning with 50% benefit in the first year of adoption and increasing by 10% each year • On a national basis, the return is then realized as follows:
How Much Does HIEI Cost? • Fewer provider interfaces required at Level 4 vs. Level 3 • Difference in stakeholder interface cost at Level 3 vs. Level 4 due to payer cost (payers only modeled at Level 4)
HIEI Principal Sources of Benefit • HIEI produces two principal types of benefit • Administrative savings • Quantify the financial value of time saved by transitioning from manual to electronic data exchange • Benefit accrues to all entities that participate in data exchange • Utilization (Avoided redundancy) • Reduction in unnecessary lab and radiology tests • Results from interoperability between providers and labs, and providers and radiology centers • Benefit accrues to the entities who pay for tests: providers and payers
Annual Net Return after Implementation Net Return over 10-year Implementation $22B $141B $24B -$34B $78B $337B HIEI National Net Cost-Benefit Level 2 Level 3 Level 4 Value of HIE standards is the difference between Level 3 & 4
Level 1 Level 2 Level 3 Level 4 10-Year Cumulative Net Return by HIEI Level $400 $300 $200 in billions $100 $0 0 1 2 3 4 5 6 7 8 9 10 $(100) $(200) Years
Limitations • Our model combines evidence from the academic literature, experts, and market data • We extrapolate to make national projections • The model may be incomplete and important determinants missing
Limitations • Benefit from secondary transactions beyond provider-centric, encounter-based model not included • Secondary benefit from enhanced data integration not included • Costs not included: • Stakeholder system cost (other than Providers and Hospitals) • Cost to develop, implement, and maintain standards • Volume discount associated with a national roll-out • Revenue loss to labs and radiology from reduction in tests • Conversion of legacy data
Limitations • Administrative benefits may be difficult to realize • Assume labor savings translate directly into dollar savings • Or, newly available resources may be used for non-revenue generating activity
Value of HIEI: Key Findings • Standardized, encoded, electronic healthcare information exchange would: • Save the US healthcare system $337B over a 10-year implementation period • Save $78B in each year thereafter • Total provider net benefit from all connections is $34B • Net benefits to other stakeholders: - Payers $22B - Pharmacies $1B - Laboratories $13B - Public Health $0.1B - Radiology centers $8B • Dramatically reduce the administrative burden associated with manual data exchange • Decrease unnecessary utilization of duplicative laboratory and radiology tests
To Achieve the Vision of HIEI • Truly interoperable systems will require: • Federal policy and financial incentives to stimulate adoption • New organizational structures to facilitate, manage, and provide oversight for HIE • Private sector investment for lab, radiology, and pharmacy systems • Public sector support for investment in public health systems, provider systems • Acceptable rules and regulations for data ownership, and sharing, between covered entities • HIEI Standards
For More Information • See www.citl.org • The Value of HIEI Full Report • Availablethrough HIMSS • Includes detailed results for individual provider organizations and hospitals • CITL Value of ACPOE Full Report • Available from CITL and HIMSS
Thank You! Davis Bu, MD, MA dbu@partners.org