Download
1 / 1
10 likes | 65 Views
On the relationship between C n 2 and humidity. (h) April 3, 2004 (night). (g) April 3, 2004 (morning). Carlos O. Font, Mark P. J. L. Chang, Erick A. Roura ¹ , Eun Oh and Charmaine Gilbreath ² ¹Physics Department, University of Puerto Rico, PO Box 9016, Mayagez, Puerto Rico

E N D
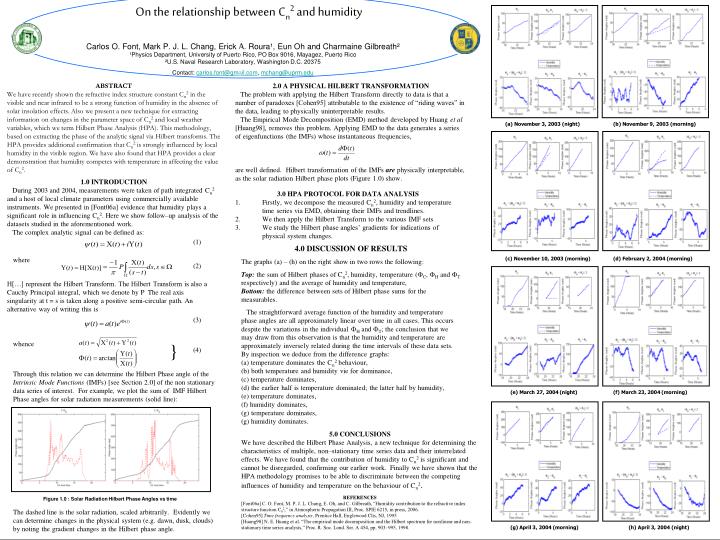
On the relationship between Cn2 and humidity (h) April 3, 2004 (night) (g) April 3, 2004 (morning) Carlos O. Font, Mark P. J. L. Chang, Erick A. Roura¹, Eun Oh and Charmaine Gilbreath² ¹Physics Department, University of Puerto Rico, PO Box 9016, Mayagez, Puerto Rico ²U.S. Naval Research Laboratory, Washington D.C. 20375 Contact: carlos.font@gmail.com, mchang@uprm.edu ABSTRACT We have recently shown the refractive index structure constant Cn2 in the visible and near infrared to be a strong function of humidity in the absence of solar insolation effects. Also we present a new technique for extracting information on changes in the parameter space of Cn2 and local weather variables, which we term Hilbert Phase Analysis (HPA). This methodology, based on extracting the phase of the analytic signal via Hilbert transforms. The HPA provides additional confirmation that Cn2 is strongly influenced by local humidity in the visible region. We have also found that HPA provides a clear demonstration that humidity competes with temperature in affecting the value of Cn2. 2.0 A PHYSICAL HILBERT TRANSFORMATION The problem with applying the Hilbert Transform directly to data is that a number of paradoxes [Cohen95] attributable to the existence of “riding waves” in the data, leading to physically uninterpretable results. The Empirical Mode Decomposition (EMD) method developed by Huang et al [Huang98], removes this problem. Applying EMD to the data generates a series of eigenfunctions (the IMFs) whose instantaneous frequencies, (a) November 3, 2003 (night) (b) November 9, 2003 (morning) are well defined. Hilbert transformation of the IMFs are physically interpretable, as the solar radiation Hilbert phase plots (Figure 1.0) show. 1.0 INTRODUCTION During 2003 and 2004, measurements were taken of path integrated Cn2 and a host of local climate parameters using commercially available instruments. We presented in [Font06a] evidence that humidity plays a significant role in influencing Cn2. Here we show follow–up analysis of the datasets studied in the aforementioned work. The complex analytic signal can be defined as: • 3.0 HPA PROTOCOL FOR DATA ANALYSIS • Firstly, we decompose the measured Cn2, humidity and temperature time series via EMD, obtaining their IMFs and trendlines. • We then apply the Hilbert Transform to the various IMF sets • We study the Hilbert phase angles’ gradients for indications of physical system changes. (1) 4.0 DISCUSSION OF RESULTS The graphs (a) – (h) on the right show in two rows the following: Top: the sum of Hilbert phases of Cn2, humidity, temperature (FC, FH and FT respectively) and the average of humidity and temperature,Bottom: the difference between sets of Hilbert phase sums for the measurables. The straightforward average function of the humidity and temperature phase angles are all approximately linear over time in all cases. This occurs despite the variations in the individual FH and FT; the conclusion that we may draw from this observation is that the humidity and temperature are approximately inversely related during the time intervals of these data sets.By inspection we deduce from the difference graphs: (a) temperature dominates the Cn2 behaviour, (b) both temperature and humidity vie for dominance, (c) temperature dominates, (d) the earlier half is temperature dominated; the latter half by humidity, (e) temperature dominates, (f) humidity dominates, (g) temperature dominates, (g) humidity dominates. where (c) November 10, 2003 (morning) (d) February 2, 2004 (morning) (2) H[…] represent the Hilbert Transform. The Hilbert Transform is also a Cauchy Principal integral, which we denote by P The real axis singularity at t = s is taken along a positive semi-circular path. An alternative way of writing this is (3) whence } (4) Through this relation we can determine the Hilbert Phase angle of the Intrinsic Mode Functions (IMFs) [see Section 2.0] of the non stationary data series of interest. For example, we plot the sum of IMF Hilbert Phase angles for solar radiation measurements (solid line): (e) March 27, 2004 (night) (f) March 23, 2004 (morning) 5.0 CONCLUSIONS We have described the Hilbert Phase Analysis, a new technique for determining the characteristics of multiple, non–stationary time series data and their interrelated effects. We have found that the contribution of humidity to Cn2 is significant and cannot be disregarded, confirming our earlier work. Finally we have shown that the HPA methodology promises to be able to discriminate between the competing influences of humidity and temperature on the behaviour of Cn2. REFERENCES [Font06a] C. O. Font, M. P. J. L. Chang, E. Oh, and C. Gilbreath, “Humidity contribution to the refractive index structure function Cn2,” in Atmospheric Propagation III, Proc. SPIE 6215, in press, 2006. [Cohen95] Time frequency analysis, Prentice Hall, Englewood Clis, NJ, 1995 [Huang98] N. E. Huang et al. “The empirical mode decomposition and the Hilbert spectrum for nonlinear and non-stationary time series analysis,” Proc. R. Soc. Lond. Ser. A 454, pp. 903–995, 1998. Figure 1.0 : Solar Radiation Hilbert Phase Angles vs time The dashed line is the solar radiation, scaled arbitrarily. Evidently we can determine changes in the physical system (e.g. dawn, dusk, clouds) by noting the gradient changes in the Hilbert phase angle.