Download
1 / 139
1.39k likes | 1.52k Views
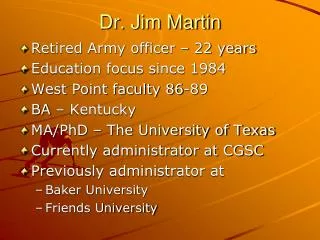
Jim Martin, Ph.D. University of Oklahoma Zarrow Center for Learning Enrichment jemartin@ou.edu http://education.ou.edu/zarrow/. Increasing the Likelihood of Obtaining a Degree and Transitioning from Postsecondary Education to Employment or Further Education. http ://education.ou.edu/zarrow/.

E N D
Jim Martin, Ph.D. University of Oklahoma Zarrow Center for Learning Enrichment jemartin@ou.edu http://education.ou.edu/zarrow/ Increasing the Likelihood of Obtaining a Degree and Transitioning from Postsecondary Education to Employment or Further Education http://education.ou.edu/zarrow/
What We Still Need to Do To Finish the Job Alternative Title
Agenda • Quiz Time • What We Know • Transition Success Anchors • Self-Determination • Goal Attainment • Disability Awareness • Preparing To Move From College to Adult Life
Quiz Time Test Your Knowledge
Seven Question Student Outcome Quiz • What percent of workers who had IEPs in high school like their jobs? • What percent of students with IEPs dropped out of HS? • Which domain is the biggest area of concern for former high school students with IEPs? • Reading Math Social Skills Health Care • What percent of former students with IEPs receive gov’t benefit payments?
More Questions • Which former group of HS students with IEPs are more likely to be single? male or female • What disability group is most likely to be enrolled in 4-year colleges? • LD EBD MR Hearing/Vision • What percent of students with IEPs in high school self-identify in postsecondary ed?
What We Know General Outcomes
Characteristics of Out-of-School Youth (NLTS2) • Social skills are the most problematic for all categories of youth • About 6 in 10 have moderate social skill scores • 28% left school without a diploma • About 70% worked since leaving HS • 40% working a couple years after leaving HS • Much lower than the 63% of same age youth without IEP
Job Site Accommodations (NLTS2 – 2005) • About 4% of those who left HS receive job site accommodations • Most employers are unaware of disability • Of employers who are aware of disability • 25% receive workplace accommodations • 40% of employed youth like their jobs • 55% of general ed workers like their jobs (Conference Board, 2007)
Emerging Independence • 2 years after leaving, 75% living with parents • Similar rate to general ed students • 66% of those living with roommate or spouse report annual income of less than $5,000 • About 10% participate in gov’t benefit program • 8% has had a child • About same rate as general population • Rate of being arrested and on probation equals rate of same age peers in general ed population
Cost of Dropping Out • DO significantly less likely to be engaged in school or work • DO more likely to support independent household and children • 4 times higher than those who completed HS • Less likely to have driver’s license or checking account, and be a voter • More than 33% spent one night in jail • 5 times higher than those who completed HS
Differences by Disability • LD or Health Impairments • 75% completed high school • 75% worked, with 45% working 2 years after HS • Large reduction in passive leisure and large increases in seeing friends often • Large declines in organized groups and volunteer activities
Differences by Disability • Emotional Disturbance • Highest dropout rate • 35% no longer live with parents • Greatest increase in living in criminal justice. mental health facilities, or on the street • 33% have not been engaged with leaving HS • 75% have been stopped by police (other than traffic violation)
Difference by Disability • Mental Retardation or Multiple Disabilities • Most likely to stay in school until 21 • Least likely to have obtained regular diploma • Lowest overall rate of engagement • Least likely to see friends • Least likely to take part in organized groups
Difference by Disability • Hearing or Visual Impairment • More than 90% obtained regular HS diploma • Twice as likely to enroll in postsecondary ed • 66% had done so • 40% enrolled in 4-year schools – highest of all groups • Most likely to be engaged in community groups • Low criminal justice contact • Those with hearing impairment less likely to see friends
Other Differences • African-American youth at 16% disadvantage compared to white youth in rate of employment • Those from higher income parental home more likely to be engaged in school or work • Females are 6 percentage points more likely to have enrolled in higher ed than males • Females less likely to be single than males
Transition from High School to IHEs • 53% of students with disabilities plan on attending an education program after leaving high school compared to 95% of their non-disabled peers (Wagner, Newman, Cameto, Garza, & Levine, 2005). • Yet only 19% of youth with disabilities follow through compared to 40% of their non-disabled peers (Wagner et al., 2005). • The rate of current enrollment of youth with disabilities in 2-year/ community colleges is not significantly different from that of their peers in the general population (10% vs. 12%). • Similar-age youth without disabilities are more than four and one-half times as likely as youth with disabilities to be currently taking courses at a 4-year college (28% vs. 6%, p<.001).
What’s Going On? • What can be done to prevent such a high drop out rate? • What can be done to improve the marginalized outcomes for minority groups of students? • Why so few former students with IEPs going on into higher ed? • What can be done to increase expectations? • Why more females than males going into higher ed? • Why do so few of those who do enroll in higher ed self-identify for disability support?
Future Transition Ed Efforts • Increased focus on teaching students disability awareness • Increased focus on teaching in-school and job site self-advocacy skills • Increased focus on building students’ expectations for adult life after high school to include going into higher ed to attain degree and better job • Increased focus on disability specific transition education practices • Autism, emotional/behavior disorders, etc
What We Know Postsecondary Education
The Numbers In Higher Education • College freshman with a disabilities increased from 2.6% in 1978 to 9% in 1996 (Cameto, Newman & Wagner, 2006). • Surveys of freshman at 4-year colleges report the percent of students with disabilities has gone from 3%, up to 9%, then down to 6% (Henderson, 1998, 2001)
Transition from High School to IHEs • 53% of students with disabilities plan on attending an education program after leaving high school compared to 95% of their non-disabled peers (Wagner, Newman, Cameto, Garza, & Levine, 2005).
Types of Higher Ed Programs • Former students with IEPs • 5% attended vocational or technical schools within two years of graduating. • 20% enrolled in community college, with 10% doing so two years later • 9% enrolled in 4-year college with 6% doing so two years later. • 30% of youth with disabilities enrolled in some type of postsecondary ed compared to 41% of their non-disabled peers (Wagner et al., 2005). • Dropped down to 20% taking classes a two years later
Rate of Enrollment • The rate of current enrollment of youth with disabilities in 2-year/ community colleges is not significantly different from that of their peers in the general population (10% vs. 12%). • Similar-age youth without disabilities are more than four and one-half times as likely as youth with disabilities to be currently taking courses at a 4-year college (28% vs. 6%, p<.001).
Disclosure & IHE Disability Support • Of youth with a high school IEP in IHE (Wagner et al., 2005). • 52% do not believe they have a disability • 7% believe they have a disability but did not disclose • 40% identified having a disability • 88% of students who identified received services • 12% rejected or refused services once offered • Put all of this together, about a third of former students with IEPs who attend postsecondary ed receive disability support
Retention and Graduation • One percent of the students with disabilities enrolled in 4-year schools graduated in a four-year period (Cameto et al., 2006). • 20% of students with LD who began IHE graduate 5 years after high school compared to 44% for students without LD (Murray, Goldstein, Nourse, & Edgar, 2000). • 10 years after high school, 44% of students with LD graduated compared to 78% without disabilities (Murray, et al., 2000). • Assume 100 students with IEPs in high school • 72 will graduate • 22 will enroll in higher education • 4 will graduate from higher education five years after starting
After Graduation from IHE • Graduates with LD employed at comparable rates as former students with LD (Madaus, Foley, McGuire, & Ruban, 2001). • Earning a degree from an IHE benefits the employment outcome of adults with learning disabilities (Madaus, 2006). • Students with disabilities other than LD graduating from IHEs appear to have less positive results (Roessler, Hennessey, & Rumrill (2007). • Some students with disabilities at IHEs lack the skills and confidence to seek employment (Corrigan, Jones, & McWhirter, 2001).
Questions and Future Trends Postsecondary Education
What’s Going On? • Why do so few students with disabilities enter higher ed? • What happens to the dreams? • Why do so few seek disability support? • Why the poor long-term graduation rate? • Why do fewer students with disabilities who graduate from college continue to graduate school? • Why do some students with disabilities (maybe as many as 33%) experience trouble transitioning from IHE into employment?
Future Trends in Postsecondary Ed • Transition education for students with disabilities enrolled in postsecondary educational programs (Sitlington, 2003) • Higher Ed needs to strongly consider adopting transition education practices to finish the job (Roessler, Hennessey, & Rumrill, 2007). • More specialty programs for students with disabilities in higher education • Focus on self-determination instruction
The Other Transition: Is There Another Task to Do? • Transition education for students with disabilities (Sitlington, 2003): • Enrolled in higher education programs • Preparing to move from higher education into full-time careers • Higher Ed needs to strongly consider adopting transition education practices to finish the job (Roessler, Hennessey, & Rumrill, 2007). • Where and Who? • Disability Resource Centers? • Career Development Offices?
Answers to Quiz Self-Score Quiz Answers
Seven Question Student Outcome Quiz - Answers • What percent of workers who had IEPs in high school like their jobs? 40% • What percent of students with IEPs dropped out of HS? 28% • Which domain biggest area of concern for former high school students with IEPs? • Reading Math Social Skills Health Care • What percent of former students with IEPs receive gov’t benefit payments? 10%
More Questions • Which former group of HS students with IEPs are more likely to be single? male or female • What disability group most likely to be enrolled in 4-year colleges? • LD EBD MR Hearing/Vision • What percent of student with IEPs in high school self-identify in postsecondary ed? • A third (appx 33%)
Transition Success Anchors Components of a Transition Education Program
Transition Education Anchors • Transition Success Behaviors • Self-Determination Skills • Teaching Goal Attainment • Disability Awareness • Preparing for Move From College to Adult Life • Adaptive Behavior Identification • Career Exploration
Self-Determination • What is SD? • What are the traits of a SD Person? • Why is SD Important?
Macro-Level SD Right of people to determine their own destiny. Empowers groups of people to take control of their own affairs and direct their own futures. What are some groups who have learned to take control of their own affairs?
UN General Assembly (1991) All people have the right to self-determination. By virtue of that right they must be free to pursue their economic, social, and cultural development.
Question What was the first act of national and democratic self-determination in the world?
Answer The American Revolution
Micro-Level SD Concerns the Individual
Self-Determined Individuals Will • Make choices and set goals based upon an understanding of their interests, skills, and limits • Express their goals to help build support • Establish a plan to attain their goal • Evaluate their plan • Adjust their goal or plan Martin & Huber Marshall, 1993
Self-Determined Learning Theory Adaptation is at the heart of Self-Determination