Download
1 / 14
140 likes | 248 Views
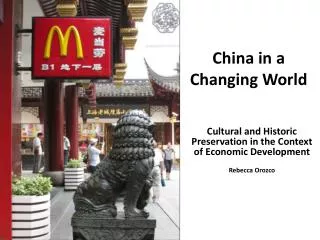
a ll the tea in China Modeling crop production in a changing climate. Presented by Rebecca Nemec 5 th Annual Friedman Fellows Symposium November 17, 2012 New York City, New York. First, a word about PowerPoint. Source: Greens, Greed and Grain blog by Michael Roberts.

E N D
all the tea in ChinaModeling crop production in a changing climate Presented by Rebecca Nemec 5th Annual Friedman Fellows Symposium November 17, 2012 New York City, New York
Agriculture and Climate Change MITIGATION & ADAPTATION
Trends in Climate in China • Warming during last 50 years (more in winter than summer) • More pronounced in minimum than maximum daily temperature • Increased frequency of short duration heat waves • Area affected by drought >6.7 million hectares since 2000 • 7-fold increase in frequency of floods since 1950s Source: Intergovernmental Panel on Climate Change Fourth Assessment Report: Climate Change 2007. Available online at: http://www.ipcc.ch/.
Global production in 2010 Source: Food and Agriculture Organization of the United Nations, FAOSTAT.
Health benefits of tea Source: Serafini et al 2011.
Tea Production in China Perennial evergreen tree or shrub Tropical and sub-tropical environments In commercial plantations trimmed to 1 m tall for easier harvesting. Can grow up to 12m. Elevation: sea level to 2,200 meters Takes three years from planting to first harvest Typical economic life span is 50 to 60 years 938mm to 6,000mm of rainfall necessary for growth In 2012 - 1.6 tons of tea produced on 2.3 million hectares Source: FAO 2010; DeMatta 2010; Ahmed and Stepp (Unpublished)
Chinese “tea belt” Source: Li et al 2011.
Trends in production over time in China Source: Food and Agriculture Organization of the United Nations, FAOSTAT and Chinese Statistical Yearbooks.
Our research • Anecdotal evidence from our collaborators’ research in Yunnan Province (interviews with Chinese tea farmers) that monsoon onset, duration and precipitation has changed in recent years • Large body of economic research that • Quantifies impact of climate change on historical production • Estimates future impacts on agriculture production (can measure both in monetary value) • Our research purpose is to • Quantify economic impacts of climate change on tea production in China • Determine which weather factors have the biggest impact on tea production • Particular focus on monsoon onset, duration, and precipitation
Draft analytical model • Ypt = Yield (tons/ha) of tea in the p province in year t. • αp = Provincial level fixed-effects -control for unobservable factors that are time invariant but vary across provinces. • λt = Time-fixed effects - changes over time in tea production that are consistent across provinces but vary over time. • Xp= Soil quality factors matrix • Organic carbon • Cation exchange capacity • Base saturation • Drainage class • Slope % • Elevation • Wpt = Weather variables matrix • Minimum temperature and maximum temperature • Growing degree-days for tea (accounts for heat that tea is exposed to) • Monsoon onset • Monsoon duration • Precipitation during monsoon season • Precipitation during the dry season (non-monsoon period) • Solar radiation
References • Auffhammer, M., Ramanathan, V., Vincent, J.R. 2012. Climatechange, the monsoon and riceyield in India. ClimaticChange 111: 411 – 424. • ChineseAgricultureYearbooks (1984-2009). PublishedbytheChineseStatistical Bureau. • DeMatta, F. 2010. Ecophysiologyof Tropical TreeCrops. Nova Science Publishers, Hauppauge, New York. • Food and Agriculture Organization of the United Nations, FAOSTAT database. Available online at: http://faostat.fao.org. • Greens, GreedandGrain Blog by Michael Roberts. Available online at: http://greedgreengrains.blogspot.com/. • Intergovernmental Panel on Climate Change Fourth Assessment Report: Climate Change 2007. Available online at: http://www.ipcc.ch/. • Li, S., Wu, X., Xue, H, Gu, B., Cheng, H., Zeng, J., Peng, C., Ge, Y., Chang, J. 2011. Quantifyingcarbonstorage of teaplantations in China. Agriculture, Ecosystems, and Environment. 390 – 398. • Serafini, M., Del Rio, D., Yao, W.N., Bettuzzi, S., Peluso, I. 2011. HerbalMedicine: Biomolecular and ClinicalAspects. 2nd Edition. BocaRaton, FL. CRC Press. • World Bank Data – GDP Deflator for China. Available online at: http://data.worldbank.org/.