Download
1 / 13
140 likes | 283 Views
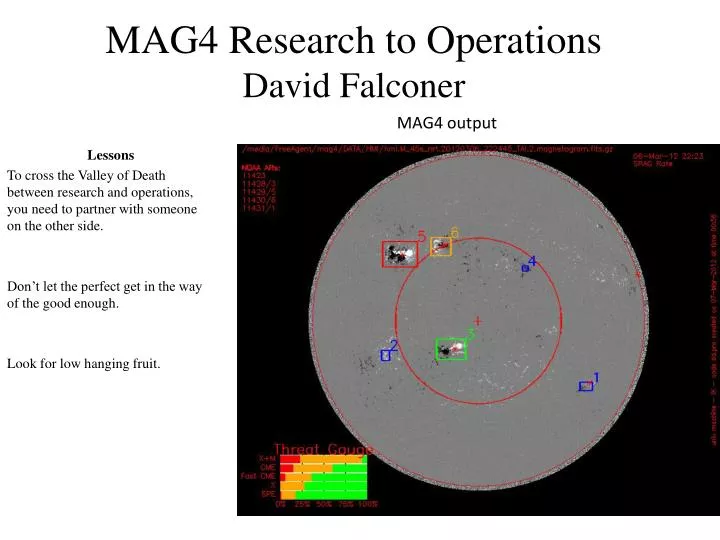
MAG4 output. MAG4 Research to Operations David Falconer. Lessons To cross the Valley of Death between research and operations, you need to partner with someone on the other side. Don’t let the perfect get in the way of the good enough. Look for low hanging fruit.

E N D
MAG4 output MAG4 Research to OperationsDavid Falconer Lessons To cross the Valley of Death between research and operations, you need to partner with someone on the other side. Don’t let the perfect get in the way of the good enough. Look for low hanging fruit.
SRAG MAG4 Forecast ToolExample Display (March 6, 2012) • Active region in upper-left corner produced the March 7 Solar Energetic particle event and geo-effective CME
Basic Research leading to MAG4 Came to MSFC and started analyzing vector magnetogram data in 1995. Canfield, Hudson, & McKenzie 1999 found that active regions that had sigmoids during disk passage were more likely to have eruptive flares than active regions that did not have sigmoids. A sigmoid is an indicator that the active region is nonpotential, they often form during a flare and so are not always a good predictor. Vector magnetograms can be used to quantify an active region nonpotentiality, though present magnetograms cannot measure the free energy of an active region. We showed through a series of papers that active regions with large free-energy proxies were more likely to flare. We refined the measures, and indentified a way to access one of the measures with a line-of-sight magnetogram. This opened up the use of the MDI data set. From a 40,000 magnetogram of 1,300 active region data set, empirically derived forecast curves to convert free-energy proxy to predicted event rate. In 2012, we showed that when controlling for free-energy proxy that active regions that have recently produced flares are more likely to produce flares in the future than active regions that have not recently produced flares. Will show this work in my other talk. Canfield, R. C., H. S. Hudson, and D. E. McKenzie, 1999, GRL, 26, 627
2007 Basic Research had reached the point that we can began to transition • Next 4 plots from Space Weather Workshop of 2007.
MSFC Vector Magnetogram of a very Nonpotential Active Region: Observed Horizontal Field Potential Horizontal Field 25,000 km An active-region field’s horizontal shear is concentrated along neutral lines where the field’s horizontal component is strong and the vertical component’s horizontal gradient is steep Observed-field upward (downward) vert. comp. is shown by solid contours or light shading (dashed contours or dark shading); red arrows show observed hor. comp. ; green arrows show hor. comp. of pot. field computed from obs. vert. comp. ; strong-observed-field (>150G) intervals of neutral lines are blue.
Format of our Correlation Plots Y-Axis Measure CME Prediction Success Rate Y-Axis Measure vs X-Axis Measure Agreement Rate (77±7)% (95±4)% Prediction Threshold for X-Axis Measure Prediction Threshold for Y-Axis Measure X-Axis Measure CME Prediction Success Rate (77±7)% Did the active region produce a CME within 72 hours after the MSFC Magnetogram? + yes + no
Performance of WLSG from MDI Magnetograms 41 ARs <30o from disk center (80±6)% (76±7)% (80±6)% (85±6)% WLSG(G) MDI WLSG(G) MDI (76±7)% (71±7)% WLSG(G) Deprojected, MSFC WLSG(G) LOS, MSFC
Decrease of CME Likelihood with Decrease of Total Nonpotentiality • X<Th/3 • Th/3<X<Th • Th<X<3Th • 3 Th<X All Clear All Clear Total Nonpotentiality Category MDI Total Nonpotentiality Category MSFC Deprojected
Transitioning Research to OperationsTimeline • 2007 First Space Weather Meeting • 2007 MURI/NADIR • 2008 Partnered with SRAG and won a TEI grant. • Begin building a database that grew to ~40,000 magnetograms of ~1,300 active region. • 2010 SRAG support for the MAG4 tool. • 2010 Began transitioning from MDI to HMI line-of-sight • 2011 installed at SRAG a NRT forecasting tool, MAG4. • 2012 Provided NOAA access to MAG4 NRT forecasts. • 2012 Improve MAG4 so that it can use a combination of free-energy proxy and previous flare activity. • 2013 Transition to HMI vector magnetograms.
Empirical Forecasting CurvesFor Forecasting an Active Region’s Next-Day Event Rates from Its Present Free-Energy Proxy • We have determined next-day event rates as a function of the active region’s free-energy proxy, for several types of events. • The sample is divided into 40 equally populated bins using the magnitude of our free-energy proxy. • For each bin, the average observed next-24-hour event rate is determined, with uncertainties. • The event rates for bins with event rates of >0.01 events/day are fitted with a power law. • This fit is used for converting our free-energy proxy to expected event rate. • Event rates can be converted into a event probability. Event Rate LWLSG(G) Proxy of Free Energy R=A(LWLSG)B P(t)=100%(1-e-Rt)
Transition Opportunities • Partner with and modify tool for other users • NOAA, Air Force, … • Have MAG4 serve as input to other tools, to better forecast secondary events (magnetic storms, SEP …) • Dusan, Jon Linker • Improve MAG4 to make better forecasts • Vector magnetograms • Determine other secondary measures
Prior Flaring is Partly Separate from Free Energy as a Predictor of an Active Region CME/Flare Productivity Free Energy Only ----- Recently Flaring Recently Non-flaring
Papers Basic Science Papers • Falconer, D., 2001, JGR, 106(11), 25,185 • Falconer, D.A., Moore, R.L., and Gary, G.A., 2002, "Correlation of the Coronal Mass Ejections Productivity of Solar Active Regions with Measures of Their Global Nonpotentiality from Vector Magnetograms: Baseline Results", ApJ569, 1016. • Falconer, D.A., Moore, R.L., and Gary, G.A., 2003, "A measure from line-of-sight magnetograms for predicting coronal mass ejections", J. Geophys. Res.108 (A10), 1380. • Falconer, D.A., Moore, R.L., and Gary, G.A., 2006, "Magnetic Causes of Solar Coronal Mass Ejections: Dominance of the Free Magnetic Energy of the Magnetic Twist Alone", ApJ644, 1256. • Falconer, D.A., Moore, R.L., and Gary, G.A., 2008, "Magnetogram Measures of Total Nonpotentiality for Prediction of Solar Coronal Mass Ejections from Active Regions of Any Degree of Magnetic Complexity", ApJ689, 1433. • Falconer, D.A., Moore, R.L., Gary, G.A., and Adams, M. 2009, "The Main Sequence of Explosive Active Regions: Discovery and Interpretation", ApJL700, L166. • Falconer, D.A., Moore, R.L., Barghouty, A. F., and Khazanov, I., 2012, "Prior Flaring as a Complement to Free Magnetic Energy for Forecasting Solar Eruptions", Astrophys. J. in press. Tool Papers • Falconer, D.A. Barghouty, A. F., Khazanov, I., and Moore, R.L., 2011, "A Tool for Empirical Forecasting of Major Flares, Coronal Mass Ejections, and Solar Particle Events from a Proxy of Active Region Free Magnetic Energy", Space Weather9 S04003.