Download
1 / 27
290 likes | 893 Views
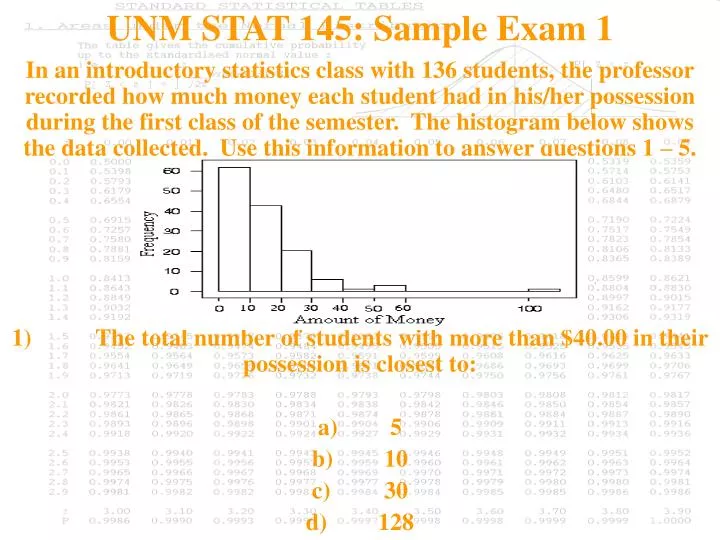
UNM STAT 145: Sample Exam 1. In an introductory statistics class with 136 students, the professor recorded how much money each student had in his/her possession during the first class of the semester. The histogram below shows the data collected. Use this information to answer questions 1 – 5.

E N D
UNM STAT 145: Sample Exam 1 In an introductory statistics class with 136 students, the professor recorded how much money each student had in his/her possession during the first class of the semester. The histogram below shows the data collected. Use this information to answer questions 1 – 5. 1) The total number of students with more than $40.00 in their possession is closest to: a) 5 b) 10 c) 30 d) 128
UNM STAT 145: Sample Exam 1 In an introductory statistics class with 136 students, the professor recorded how much money each student had in his/her possession during the first class of the semester. The histogram below shows the data collected. Use this information to answer questions 1 – 5. 2) The percentage of students with more than $10.00 but less than $30.00 is closest to a) 20% b) 46% c) 63% d) 88%
UNM STAT 145: Sample Exam 1 In an introductory statistics class with 136 students, the professor recorded how much money each student had in his/her possession during the first class of the semester. The histogram below shows the data collected. Use this information to answer questions 1 – 5. 3) The third quartile for this distribution occurs in which class interval? a) 10-20 b) 20-30 c) 30-40 d) 40-50
UNM STAT 145: Sample Exam 1 In an introductory statistics class with 136 students, the professor recorded how much money each student had in his/her possession during the first class of the semester. The histogram below shows the data collected. Use this information to answer questions 1 – 5. 4) If the outlier on the right is removed, the value of the mean will: a) increase b) decrease c) stay the same d) not enough information to answer
UNM STAT 145: Sample Exam 1 In an introductory statistics class with 136 students, the professor recorded how much money each student had in his/her possession during the first class of the semester. The histogram below shows the data collected. Use this information to answer questions 1 – 5. The mean for this distribution would be a) to the right of the median b) to the left of the median c) the same as the median d) greater than $100.00
UNM STAT 145: Sample Exam 1 Below are side-by-side box plots comparing the pulse rates of those students in an introductory statistics class who ran before taking their pulse rate (group 1) and those who did not run before taking their pulse rate (group 2). Use these box plots to answer questions 6 - 7. 6) Which group has a greater proportion of its observations below a pulse rate of 82? a) group 1 b) group 2 c) they would be about the same d) not enough information
UNM STAT 145: Sample Exam 1 Below are side-by-side box plots comparing the pulse rates of those students in an introductory statistics class who ran before taking their pulse rate (group 1) and those who did not run before taking their pulse rate (group 2). Use these box plots to answer questions 6 - 7. 7) Approximately 25% of the students in group 1 had a pulse rate above: a) 58 b) 76 c) 88 d) 106
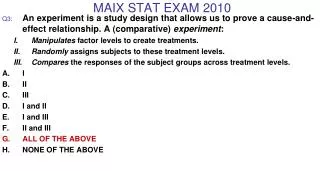
UNM STAT 145: Sample Exam 1 8) Three randomly selected students had quiz scores of -4, 5, and 8. The standard deviation for this sample is: a) 0 b) 6.245 c) 16.667 d) 39.000
UNM STAT 145: Sample Exam 1 9) In the early part of the 20th century it was noticed that, when viewed over time, the number of crimes increased with membership in the Church of England. The most likely explanation for this is: a) Church leaders were encouraging their members to commit crimes. b) Both crimes and Church membership increased as the population increased. c) Crime rate is a lurking variable. d) Church membership is a lurking variable.
UNM STAT 145: Sample Exam 1 10) Which of the following statements is true: a) the mean of a sample is always greater than the std. dev. of the sample. b) the std. dev. for a data set with 3 observations must always be positive. c) the 3Q of a data set must always be greater than the 1Q of the data set. d) the mean of a data set can be negative but the std. dev. of a data set can never be negative
UNM STAT 145: Sample Exam 1 11). You have the weights in milligrams of 17 adult fleas. You find the standard deviation of the weights to be 17.003. The correct unit for the standard deviation in this problem is: a) no units -- the standard deviation is just a number b) grams squared c) milligrams d) milligrams squared
UNM STAT 145: Sample Exam 1 (Problems 12 and 13) A sample of 20 employees from the local Honda plant was obtained and the length of time (in months) worked was recorded for each employee. A stemplot of these data follows. In the stemplot, 5|2 represents 52 months. 5 2 4 8 9 9 6 0 3 5 6 7 7 8 9 7 3 4 7 8 9 9 8 9 8 12. The mean length of time (in months) worked for these 20 employees is a. 66 b. 67 c. 67.5 d. 68.25
UNM STAT 145: Sample Exam 1 (Problems 12 and 13) A sample of 20 employees from the local Honda plant was obtained and the length of time (in months) worked was recorded for each employee. A stemplot of these data follows. In the stemplot, 5|2 represents 52 months. 5 2 4 8 9 9 6 0 3 5 6 7 7 8 9 7 3 4 7 8 9 9 8 9 8 13. The first quartile of the length of time (in months) worked for these 20 employees is a. 5.5 b. 59.5 c. 75.5 d. 67
UNM STAT 145: Sample Exam 1 (Problems 14 and 15) Consumers Union measured the gas mileage per gallon of 38 1998-99 model automobiles on a special test track. The following pie chart provides information about the country of manufacture of the model cars that Consumers Union used. 14. Based on this pie chart, we may conclude that a. Japanese cars get significantly lower gas mileage than cars of other countries. This is because their slice of the pie is at the bottom of the chart. b. more than half of the cars in the study were from the U.S. c. Swedish cars get gas mileages that are between those of Japanese and U.S. cars. d. Mercedes Benz, Audi, Porsche, and BMW represent approximately a quarter of the cars tested.
UNM STAT 145: Sample Exam 1 (Problems 14 and 15) Consumers Union measured the gas mileage per gallon of 38 1998-99 model automobiles on a special test track. The following pie chart provides information about the country of manufacture of the model cars that Consumers Union used. 15. Which of the following bar graphs is equivalent to the pie chart? (a,b,c,d)
UNM STAT 145: Sample Exam 1 16. The five-number summary of a set of data a. is the mean, standard deviation, first quartile, median, and third quartile. b. is the mean, median, mode, variance, and standard deviation. c. can be computed from the information in a stemplot. d. is the minimum, the interquartile range, the mean, the median, and the maximum.
UNM STAT 145: Sample Exam 1 17. The average salary of all female workers at a large plant is $35,000. The average salary of all male workers at the plant is $41,000. If there are more male workers than female workers at the plant, then the average salary at the plant must be a. exactly $38,000. b. larger than $38,000. c. smaller than $38,000. d. above $41,000.
UNM STAT 145: Sample Exam 1 Use the following density curve to answer questions 18 – 20. 18. For this density curve, the third quartile is a. 0.5. b. 0.75. c. 1.5. d. 1.75.
UNM STAT 145: Sample Exam 1 Use the following density curve to answer questions 18 – 20. 19. For this density curve, what percent of the observations lie between 0.25 and 0.50? a. 0.25% b. 12.5% c. 25% d. 50%
UNM STAT 145: Sample Exam 1 Use the following density curve to answer questions 18 – 20. 20. Scores on a University exam are normally distributed with a mean of 68 and a standard deviation of 9. Using the 68-95-99.7 rule, what percentage of students score above 77? a. 2.5% b. 5% c. 16% d. 32%
UNM STAT 145: Sample Exam 1 21. The time to complete a standardized exam is approximately normal with a mean of 70 minutes and a standard deviation of 10 minutes. Using the 68-95-99.7 rule, if students are given 90 minutes to complete the exam, what percentage of students will not finish? a. 32% b. 5% c. 2.5% d. 0.0015%
UNM STAT 145: Sample Exam 1 22. Using the standard normal distribution tables, what is the area under the standard normal curve corresponding to Z < 1.15? a. 0.1357 b. 0.8643 c. 0.8749 d. 0.9332
UNM STAT 145: Sample Exam 1 23. The scores on a university examination are normally distributed with a mean of 62 and a standard deviation of 11. If the bottom 5% of students will fail the course, what is the lowest mark that a student can have and still be awarded a passing grade? a. 62 b. 57 c. 44 d. 40
UNM STAT 145: Sample Exam 1 24. A stemplot of a set of data is roughly symmetric, but the data do not even approximately follow the 68-95-99.7 rule. We conclude that the data are a. normal, but they are not standard normal. b. standard normal. c. not normal. d. normal.
UNM STAT 145: Sample Exam 1 25. Chocolate bars produced by a certain machine are labeled as 8.0 oz. The distribution of the actual weights of these chocolate bars is normal with a mean of 8.1 oz. and a standard deviation of 0.1 oz. The proportion of chocolate bars with weights between 8.2 and 8.3 oz. is a. 0.819. b. 0.636. c. 0.477. d. 0.136.
UNM STAT 145: Sample Exam 1 Answers: 1 A 2 B 3 A 4 B 5 A 6 B 7 D 8 B 9 B 10 D 11 C 12 D 13 B 14 B 15 B 16 C 17 B 18 C 19 B 20 C 21 C 22 C 23 C 24 C 25 D
Josh Shainin bronco@unm.edu http://www.bronco.tv Special Thanks to the UNM Statistics Department http://math.unm.edu/courses/stat145/index.php


![Pass Your NS0-145 Exam with Authentic NS0-145 Dumps [PDF]](https://cdn4.slideserve.com/7884742/netapp-dt.jpg)
![NS0-145 Exam Dumps - Pass with NS0-145 Dumps PDF [2018]](https://cdn4.slideserve.com/7913396/netapp-ns0-145-exam-netapp-certified-design-dt.jpg)