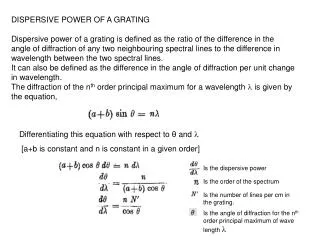
Download
1 / 20
200 likes | 432 Views
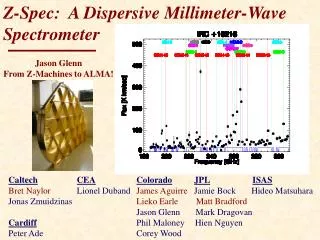
Using a Wavelength Dispersive Spectrometer to measure XAFS. Matt Newville, Steve Sutton, Mark Rivers, Peter Eng GSECARS. GSECARS beamline and microprobe station, Kirkpatrick-Baez mirrors. XAFS and x-ray fluorescence measurements. The Wavelength Dispersive Spectrometer.

E N D
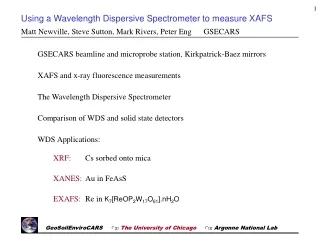
Using a Wavelength Dispersive Spectrometer to measure XAFS Matt Newville, Steve Sutton, Mark Rivers, Peter Eng GSECARS GSECARS beamline and microprobe station, Kirkpatrick-Baez mirrors XAFS and x-ray fluorescence measurements The Wavelength Dispersive Spectrometer Comparison of WDS and solid state detectors WDS Applications: XRF: Cs sorbed onto mica XANES: Au in FeAsS EXAFS: Re in K7[ReOP2W17O61].nH2O GeoSoilEnviroCARS l The University of Chicago l Argonne National Lab
The GSECARS Microprobe The GeoSoilEnviroCARS beamline 13-IDC provides a micro-beam facility for x-ray fluorescence (XRF) and x-ray absorption spectroscopy (XAS) studies in earth and environmental sciences. sample x-y-z stage: 0.1mm step sizes Horizontal and Vertical Kirkpatrick-Baez focusing mirrors fluorescence detector: multi-element Ge detector (shown), Lytle Chamber, Si(Li) detector, or Wavelength Dispersive Spectrometer optical microscope (10x to 50x) with video system GeoSoilEnviroCARS l The University of Chicago l Argonne National Lab
Kirkpatrick-Baez focusing mirrors The table-top Kirkpatrick-Baez mirrors use a four-point bender and a flat, trapezoidal mirror to dynamically form an ellipsis. They can focus a 300x300mm monochromatic beam to 1x1mm - a flux density gain of 105. With a typical working distance of 100mm, and an energy-independent focal distance and spot size, they are ideal for micro-EXAFS. We routinely use Rh-coated silicon (horizontal) and fused-silica (vertical) mirrors to produce 4x4mm beams for XRF, XANES, and EXAFS. GeoSoilEnviroCARS l The University of Chicago l Argonne National Lab
X-ray Absorption Spectroscopy: XANES and EXAFS Measure the energy-dependence of the x-ray absorption coefficient m(E) [either log(I0 /I) or (If / I0 )] through a core-level energy of a selected element. XANES = X-ray Absorption Near-Edge Spectroscopy EXAFS = Extended X-ray Absorption Fine-Structure Characteristics of XANES and EXAFS: Element Specific: all elements (with Z>20 or so) can be measured at APS Low Concentration: selected element can be as low as a few ppm Natural Samples: crystallinity is not required -- samples can be liquids, amorphous solids, soils, aggregates, and surfaces. Local Structure: EXAFS gives atomic species, distance, and number of near-neighbor atoms around selected element Valence Probe: XANES gives chemical state and formal valence of selected element GeoSoilEnviroCARS l The University of Chicago l Argonne National Lab
X-ray Absorption Fine-Structure Spectroscopy 1. An x-ray of energy E is absorbed by an atom, destroying a core electron with energy E0, and creating a photo-electron with energy (E-E0). 2. The probability of absorption m(E) depends on the overlap of the core-level and photo-electron wave-functions. Since the core-level is localized, this overlap is determined by the photo-electron wave-function at the center of the absorbing atom. For an isolated atom , this is a smooth function of energy. 3. With another atom nearby, the photo-electron can scatter from the neighbor. The interference of the outgoing and scattered waves alters the photo-electron wave-function at the absorbing atom, modulating m(E). 4. The oscillations in m(E) depend on the near-neighbor distance and species (the energy-dependence of the scattering amplitude depends on Z). GeoSoilEnviroCARS l The University of Chicago l Argonne National Lab
Typical GSECARS Microprobe Application: XRF / EXAFS Sr in coral Nicola Allison, Adrian Finch (Univ of Brighton, Univ of Hertfordshire, UK) A common use of the microprobe is to make an x-ray fluorescence (XRF) map and then collect XANES or EXAFS on selected spots in that map. The abundance of Sr in aragonite (CaCO3) formed by corals has been used as an estimate of seawater temperature and composition at aragonite formation. XRF maps of a section of the coral were made with a 5mm X 5mm beam and a 5mm step size. The Sr and Ca fluorescence (and several other trace elements) were measured simultaneously at each pixel with a multi-element Ge solid-state detector. The Sr and Ca maps show incomplete correlation. The relative Sr abundance therefore varies substantially on this small length scale, although this section of aragonite must have been formed at constant temperature. Ca Sr 200mm 300mm The Sr XAFS was measured at a spot with fairly high Sr concentration -- above the solubility limit of Sr in aragonite... GeoSoilEnviroCARS l The University of Chicago l Argonne National Lab
Typical GSECARS Microprobe Application: XRF / EXAFS Sr in coral Since the Sr concentration was above its solubility limit (~1%) in aragonite, it was not known if Sr would precipitate out into strontianite (SrCO3: a structural analog of aragonite), or remain in the aragonite phase. First shell EXAFS is same for both strontianite and aragonite: 9 Sr-O bonds at ~2.5A, 6 Sr-C at ~3.0A. Second shell EXAFS clearly shows Sr-Ca (not Sr-Sr) dominating, as shown at left by contrast to SrCO3 data, and by comparison to a FEFF-simulated EXAFS spectrum of Sr substituted into aragonite. The coral is able to trap Sr in aragonite at a super-saturated concentration. GeoSoilEnviroCARS l The University of Chicago l Argonne National Lab
Fluorescence XAFS measurements XRF and XAFS in natural and heterogeneous samples can be complicated by the presence of fluorescence lines from other elements near the line of interest. A detector with some energy-resolution helps discriminate against photons at uninteresting energies. Fe K-edge 7.112 KeV Fe Ka line 6.403 KeV Fe Kb line 7.057 KeV Co K-edge 7.709 KeV Co Ka line 6.930 KeV Example: a dilute quantity of Co in an Fe-rich system. The Fe will be excited by the Co K-edge radiation. Even though the Fe Kb is 5X weaker than the Fe Ka intensity, it may be much larger than the Co Ka intensity. Similar conflicts occur when two L lines interfere with each other (the La and Lb are about the same intensity, too), or when an L and a K-line interfere. Si(Li) and Ge solid-state detectors give energy resolutions of ~100 to ~300 eV (with the best resolution often limiting count rates to ~1KHz), which is sometimes not good enough. These detectors are also limited in total count rate(up to ~100KHz, but at the worst resolution), which can be a problem -- especially with intense x-ray beams. GeoSoilEnviroCARS l The University of Chicago l Argonne National Lab
The Wavelength Dispersive Spectrometer (Oxford WDX-600) Borrowing technology developed for the electron-microscope community, the Wavelength Dispersive Spectrometer uses an analyzer crystal on a Rowland circle to select a fluorescence line. This has much better resolution (~30eV) than a solid state detector (~250eV), doesn’t suffer from electronic effects like dead-time, and can have superior peak-to-background ratios. The solid-angle and count-rates are somewhat lower. Sample and x-y-z stage Kirkpatrick-Baez focusing mirrors Ion chamber Table-top slits Optical microscope Wavelength Dispersive Spectrometer GeoSoilEnviroCARS l The University of Chicago l Argonne National Lab
210mm Rowland circle containing sample, crystal analyzer, and detectors GeoSoilEnviroCARS l The University of Chicago l Argonne National Lab
WDX-600: detailed view detectors = 2 proportional counters: (one flowing P-10 gas, and one sealed with 2 atm Xe) in tandem. slits: define angular acceptance and energy resolution crystals = LiF (200), LiF(220), LiF(420), and PET, on a six crystal turret. Crystal size ~45 x 15 mm By using a Johannson geometry Rowland circle, a point source focuses to a point at the detector slit. Aberrations are minimized, and the signal-to-noise ratio is improved. GeoSoilEnviroCARS l The University of Chicago l Argonne National Lab
Comparisons of the WDS and solid-state detectors Steve Sutton and Mark Rivers, data collected at NSLS X-26A. Here’s part of the XRF spectra for a synthetic glass containing several rare-earth elements using both a Si(Li) detector and the WDS. GeoSoilEnviroCARS l The University of Chicago l Argonne National Lab
Comparisons of the WDS and solid-state detectors Typical values for the WDS and a Ge solid-state detector Ge Solid-State WDS energy resolution: ~30eV ~100eV to ~300eV depending on shaping time active area: ~500mm2` 100mm2 (per detector, often 13X) (varies with angle) working distance: ~180mm ~100mm max total count rate: none 100KHz(per detector, often 13X) GeoSoilEnviroCARS l The University of Chicago l Argonne National Lab
Issues using the WDS Alignment: The WDS weighs ~30kg, and needs to be aligned fairly well: ~1 mm vertical ~1 mm in/out-board ~10mm up/down-stream For our initial run, we adjusted the height by hand, and had a motorized in/out-board motion. For the up/down-stream position, we brought the sample to the spectrometer, which limits the focusing ability of the microprobe. Tunability: The WDS selects one energy at a time, and looking at different energies requires a mechanical scan. So, unlike a solid-state detector, the WDS does not simultaneously measure multiple energies --- it does not have an MCA. So XRF maps of multiple elements (like the Sr/Ca example) are not practical with the WDS. GeoSoilEnviroCARS l The University of Chicago l Argonne National Lab
Using the WDS for XRF: Cs on biotite S Sutton, J McKinley, J Zachara (PNNL) Biotitie is a mica that contains trace amounts of many transition metals, a few percent Ti, and major components of Ca and Fe. To study how Cs would bind to the surface and layers of the biotite, McKinley and Zachara exposed a cross-cleavage plane of biotite to a Sr-rich solution. With a solid-state detector, the Cs La line (at 4.286KeV) was a small shoulder on the Ti Ka line (at 4.510KeV), making a map of Cs concentration from the La intensity was impossible. Mapping with the Cs K-edge was not useful either (x-rays too penetrating into bulk mica, and too much inelastic scattering). The map at right shows the Cs concentration as measured with the WDS on the Cs La line. 100 x 100mm image, with a 5 x 5mm beam, taking 3mm steps, with a 30s dwelltime at each point. The incident x-ray energy was 10KeV. GeoSoilEnviroCARS l The University of Chicago l Argonne National Lab
Using the WDS for XANES: 1000ppm Au in FeAsS (arsenopyrite) Louis Cabri (NRC Canada), Robert Gordon, Daryl Crozier (Simon Fraser), PNC-CAT 1000ppm Au in FeAsS (arsenopyrite): The understanding of the chemical and physical state of Au in arsenopyrite ore deposits is complicated by the proximity of the Au LIII and As K edges and their fluorescence lines. At the Au LIII-edge, As will also be excited, and fluoresce near the Au La line. As K-edge 11.868 KeV As Ka line 10.543 KeV Au LIII-edge 11.918 KeV Au La line 9.711 KeV Even using the WDS, the tail of the As Ka line persists down to the Au La line, and is still comparable to it in intensity. GeoSoilEnviroCARS l The University of Chicago l Argonne National Lab
Using the WDS for XANES: 1000ppm Au in FeAsS (arsenopyrite) Louis Cabri (NRC Canada), Robert Gordon, Daryl Crozier (Simon Fraser), PNC-CAT With a 13-element Ge detector (at PNC-CAT: ID-20), the tail of the As Ka line was still strong at the Au La energy, so the Au LIII edge-step was about the same size as the As K edge-step, and the Au XANES was mixed with the As EXAFS. With the WDS, the As edge was visible, but much smaller, so the Au XANES was clearer. Measuring two different natural samples of FeAsS, both with ~1000ppm of Au, we see evidence for both metallic and oxidized Au. GeoSoilEnviroCARS l The University of Chicago l Argonne National Lab
Using the WDS for EXAFS: Re in K7[ReOP2W17O61].nH2O Mark Antonio (ANL) The inorganic molecule a-P2W17O61is a candidate for stabilizing transition and rare-earth metal ions. It can lose a WO ligand and replace it with several valence states of Re (a nice, safe chemical analog of Tc). The proximity of the Re and W LIII-edges, and their La lines, and the relative concentrations of Re and W (1::61) in this sample makes EXAFS measurements using a solid-state detector nearly impossible. W LIII-edge 10.204 KeV W La line 8.396 KeV Re LIII-edge 10.534 KeV Re La line 8.651 KeV Venturelli, et al, J. Chem. Soc., Dalton Trans., p 301 (1999) GeoSoilEnviroCARS l The University of Chicago l Argonne National Lab
Using the WDS for EXAFS: Re in K7[ReOP2W17O61].nH2O Here are m(E), the EXAFS kc(k), and the Fourier transform of the EXAFS |c(R)| for data collected with the WDS. The data is the average of 3 scans, each having an integration time of 5 seconds per point. The data quality is acceptable up to ~12A-1, and initial analysis supports a first shell with 4 oxygens at 1.8A. GeoSoilEnviroCARS l The University of Chicago l Argonne National Lab
Using a Wavelength Dispersive Spectrometer to measure XAFS The Wavelength Dispersive Spectrometer can be used for XANES and EXAFS measurements. In some cases it is sometimes the only detector capable of such measurements. In many cases, the WDS compares favorably with solid state detectors. In some cases, the WDS is superior to solid-state detectors, and is the only detector capable of XRF, XANES, and EXAFS measurements. GeoSoilEnviroCARS l The University of Chicago l Argonne National Lab