Download
1 / 21
340 likes | 1k Views
ECG Signal Processing. Ojasvi Verma 121852 M.Sc Communicative Electronics IEM3220 Physiology and Engineering May 3, 2013. Overview. What is an ECG? Overview of the ECG procedure How does the ECG work? Why perform an ECG? Interpretation of the ECG Quality of the ECG

E N D
ECG Signal Processing Ojasvi Verma 121852 M.Sc Communicative Electronics IEM3220 Physiology and Engineering May 3, 2013
Overview • What is an ECG? • Overview of the ECG procedure • How does the ECG work? • Why perform an ECG? • Interpretation of the ECG • Quality of the ECG • Rate, Rhythm, Axis • ECG wave • Signal Acquisition • Algorithms for ECG Signal Processing??Simple physiology?? • ECG Digital Filters • ECG baseline wander • Heart Rate Data Algorithm • Autocorrelation function of energy signal • Threshold of energy signal • Application of designed algorithm • Results • Further work
What is an ECG? Electrocardiography (ECG) is a transthoracic interpretation of the electrical activity of the heart over a periodof time, as detected by electrodes attached to the surface of the skin and recorded by a device external to the body. An ECG is used to measure - the rate and regularityof heartbeats as well as - the size and position of the chambers, - the presence of any damage to the heart and - the effects ofthe drugs or devices used to regulate the heart.
Overview of the ECG Procedure • GRIP – Greet, report, identify, introduce, procedure, privacy, permission. • Lay patient down. • Expose chest, wrinkles, ankles. • Clean electrode sites. • Apply electrodes. • Attach wires correctly. • Turn on machine- calibrate to 10mm/mV, rate at 25mm/s. • Record and print. • Label the tracing- Name, DoB, hospital number, date and time. • Disconnect if adequate and remove electrodes.
How does ECG work? • Electrical Pulses picked up by the placing electrodes on patient. • The voltage change sensed by measuring the ??current?? change across two electrodes– a positive electrode and a negative electrode. • If the electrical impulse travels toward the positive electrode this results in a positive deflection. • If the pulse travels away from the positive electrode this results in a negative deflection.
Why perform an ECG? It’s part of the admission bundle. • indicated by the patients symptoms - symptoms of IMD/MI. - symptoms associated with dysrhythmias. • indicated by the patients findings - cardiac murmur.
Interpretation of the ECG • Quality of ECG? • Rate • Rhythm • Axis • P wave • PR interval • QRS interval • QRS morphology • Abnormal Q waves • ST segment. • T wave • QT interval
Quality of the ECG • Patient Name • Date of the ECG • Is there any interference • Is there electrical activity from all 12 leads. • Calibration: - speed:25mm/second - height:1cm/mV
Rate , Rhythm , Axis • Rateis either - normal - bradycardic - tachycardic • Rhythm - are there P waves? - are they regular? - does one precede every QRS Complex? - regular vs irregular • Axis
Axis??? Positive in I and II = NORMAL Positive in I and negative in II = LAD Negative in I and positive in II = RAD
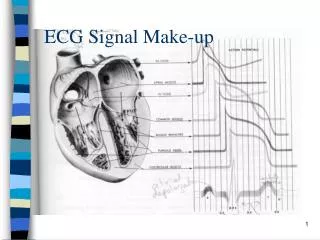
ECG wave The normal ECG composed of - a P wave, - a QRS complex, and - a T wave. The P wave represents atrial depolarization. The QRS complexrepresents ventricular depolarization. The T wave reflects the phase of rapid repolarization of the ventricles.
Signal Acquisition ECG signal for digital signal processing and heart rate calculation acquired by measurement card with sampling frequency fs=500 Hz. Analog signal pre-processing was done on simple amplifier circuit designated for ECG signal measurement. The signal was used as an input signal for the digital filters and the heart rate detection algorithms designing and testing.
ECG Digital Filters Noise elements filtering and baseline wander elimination with digital filters. The main noise elements are power supply network 50 Hz frequency and breathing muscle movements. These artefacts have to be removed before the signal is used for next data processing like heart rate frequency determination.
Heart Rate data Algorithms Algorithms compute heart rate frequency from the signal energy. The signal energy was pre-processed in preceding part. All three described algorithms were used on same signal. It means it is possible to compare the results and to choose the best one. a.Autocorrelation function of Energy Signal. b.Threshold of energy signal. c.Peak detection in energy signal envelope.
Applications of designed Algorithm The designed algorithms were applied to compute heart rate frequency from ECG signals which were measured during stress tests. ECG signal was certainly filtered by digital filters. The heart rate frequency was computed in frames of signal with length of 4 s which were 2 s overlapped. The division of signal to frames simulates real-time processing which will be used in microprocessor implementation.
Results The designed digital filters and the heart rate frequency algorithms are very simple. The filters have small order. It saves the computing time, but it is very effective for processing the ECG signal. It is the reason why these algorithms could be easily implemented to microprocessor unit.
Further work In future healthcare, wireless sensors can be integrated into "smart clothes", monitoring the health status of a patient continuously. For hearth-diseases, a mobile electrocardiogram (ECG) can be worn that detects abnormalities automatically and transmits this information to the patient's smart phone orto a hospital. Thanks