Download
1 / 21
210 likes | 343 Views
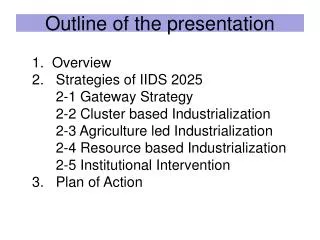
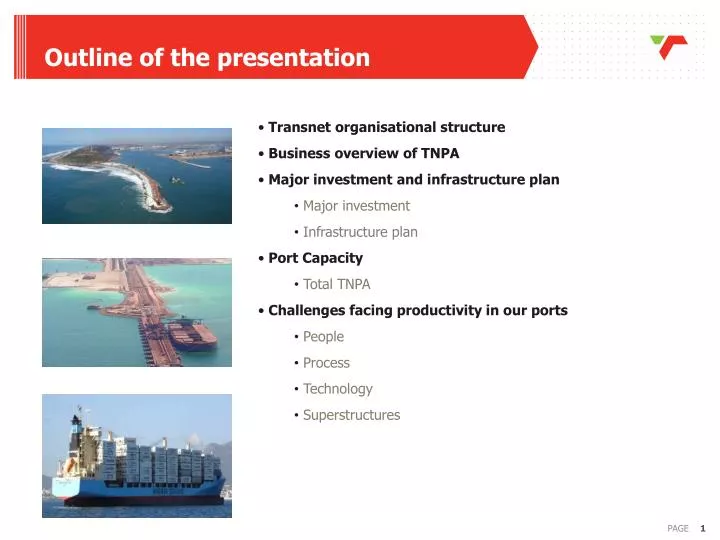
Outline of the presentation. Transnet organisational structure Business overview of TNPA Major investment and infrastructure plan Major investment Infrastructure plan Port Capacity Total TNPA Challenges facing productivity in our ports People Process Technology

E N D
Outline of the presentation • Transnet organisational structure • Business overview of TNPA • Major investment and infrastructure plan • Major investment • Infrastructure plan • Port Capacity • Total TNPA • Challenges facing productivity in our ports • People • Process • Technology • Superstructures
Transnet Organisational Structure • Transnet Capital Projects • Transnet Property • Transnet Foundation • 8 Commercial ports • – Ngqura became operational during October 2009 • Revenue R8.4bn • Assets R56bn • 3 558 employees • 16 Cargo terminal operations across SA ports • Revenue R6bn • Assets R13.5bn • 5 895 employees • 18 billion litresof petroleum products and gas through 3000km pipelines, mainly to Gauteng • Revenue R1.3bn • Assets R20.1bn • 600 employees • 20 500 km of railway track • 182 million tons of freight • General freight and 2 heavy haul export lines • Revenue R22.2 bn • Assets R54.7bn • 24 177 employees • Support to TFR for rolling stock maintenance • Revenue R9.8bn • Assets R6.8bn • 13 020 employees 2
Four Core Business Activities Infrastructure Marine Services Dredging Lighthouses Eight Operational Ports Core Business & Key Commodities • Core Business: • Infrastructure – Capacity planning, Development, Maintenance • Marine Services – Pilotage, Tug and Berthing Services • Dredging – Maintenance dredging and Hydro graphic surveys • Lighthouse Services – Provision of Aids to Navigation • Ports – key commodities: • Durban – Containers, Autos and Liquid bulk • Richards Bay – Coal • Saldanha – Iron Ore • Port Elizabeth – Containers and Autos • Cape Town – Containers and Fruit • East London – Autos • Ngqura – Containers • Mossel Bay – Liquid bulk Mossel Bay Business overview • The National Ports Authority is a landlord Port Authority that provides port infrastructure and maritime-related services at the South African ports. Key business parameters : • R 9.2 bn Total Revenue • R 59.1 bn Total assets • 8 operational ports – coastline approx. 2 800km • 97 berths (18 container,21 dry bulk, 37 break-bulk,16 liquid bulk, 5 automotive • 58 maritime craft (30 tugs, 9 pilot boats, 7 workboats, • 3 pilot helicopters, 5 dredgers, 4 survey boats) • 3 566 employees countrywide 3 3
Outline of the potential investments • Durban International Airport Site • Port of Ngqura
Current SiteOld Durban International Airport (DIA) long term potential
Development Phasing and Costing(DIA) Typical Port Investment – (2017-2026)
PORT OF NGQURA Future developments • Relocation of the Manganese terminal from the Port of Port Elizabeth (PE) to Ngqura by 2015: • Construction of a Manganese ore berth • Relocation of the Tank farm from the Port of PE to Ngqura by 2015 • Construction of a Liquid Bulk berth
Outline of the major infrastructure • Port of Durban • Entrance channel widening and deepening • Port of Ngqura • Dredging of the Channel • Berth extensions • Port of Cape Town • Berth deepening
Durban Entrance Widening and Deepening during construction 2008 Total investment • R3.0 Bn Channel Depth from: • 12.8m to 16.m The width increased from • 130m to 220m During Construction After Construction
NGQURA 2011 Current Layout Current Operations • Two container Berths • Two MPT Berths By end of May 2012 • Move from two to four container berths Immediate Future
CAPE TOWN Current Operations • Four container Berths 12.8 m draft • Two MPT Berths 11.2m draft By end of November 2012 • Move to four container berths 14.2m draft Current Layout Immediate Future
Outline of the challenges facing productivity in our ports • People • Shortage of critical skills • Aging workforce • Processes • Manual processes • Lack of uniform productivity measures • Superstructure • Aging tug fleet • Aging cranes
External Challenges • Economic regulation • Introduction of the National Ports Act of 2005 brought new challenges to the Authority, i.e. • tariff determinations • Increase in legal matters • Revenue uncertainty
Recognized Maritime/Port Security Threats Lack of a collaborative maritime security strategy Piracy Maritime Terrorism Contraband Smuggling/Trafficking Incidence of Stowaways Insufficient coastal protection capacity Lack of ‘deep water’ patrol capacity Incidence of Trespassing Illegal exploitation of natural resources, e.g. poaching abalone, fish Prohibited imports/exports Potential Marine pollution Maritime Port Security Challenges