Download
1 / 33
330 likes | 431 Views
On the use of indices to study changes in climate extremes. EGS-AGU-EUG Joint Assembly Nice, France, 10 April 2003 Albert Klein Tank KNMI, the Netherlands. Guide. How do we define extreme events? Extremes in daily precipitation and temperature series from weather stations

E N D
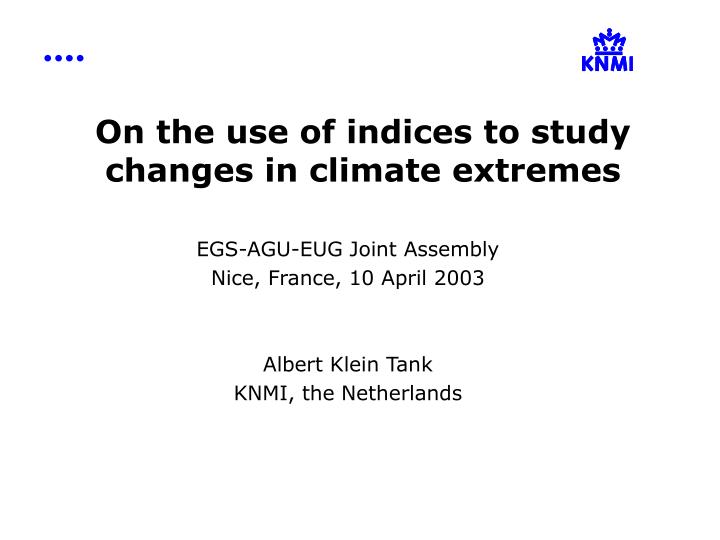
On the use of indices to study changes in climate extremes EGS-AGU-EUG Joint Assembly Nice, France, 10 April 2003 Albert Klein Tank KNMI, the Netherlands
Guide • How do we define extreme events? • Extremes in daily precipitation and temperature series from weather stations • Observed trends in Europe, 1946-now • “amplified” response of very wet days • “asymmetric” warming of cold & warm tail
! www.cred.be
WMO status of global climate in 2002 www.wmo.ch
Day-count indices of extremes www.knmi.nl/samenw/eca/
Day-count indices of extremes www.knmi.nl/samenw/eca/
3x 6x Day-count indices of extremes Relation between relative trend bq/X required for 80% detection probability (5% level) and series length N for extreme events with average return period Tret Klein Tank and Können, J. Climate (accepted)
“Amplified” response of very wet days Linear trends in rainy season, last ~50 years Easterling et al. (BAMS, 2000) in IPCC-TAR
2) Determine fraction of total precipitation in each year that is due to these days 3) Trend analysis in series of fractions Precipitation fraction due to very wet days “R95%tot” 1) Identify very wet days using a site specific threshold = 95th percentile at wet days in the 1961-90 period
Trends 1961-2001 APN 2002 (Della-Marta, Haylock et al.) www.bom.gov.au/bmrc/csr/apn/
Caribbean workshop, Jamaica 2001 (Peterson et al., 2002, JGR)
Trends in 5-day rainfall total 1961-1990 Africa workshop, Casablanca 2001
European precipitation trends • Averaged over Europe, all indices of wet extremes saw increases between 1946-1999, although spatial trend coherence is low and many station trends are not significant • The index that represents the fraction of the annual amount due to very wet days gives a signal of disproportionate large changes in the extremes • IPCC-TAR: • “2 to 4% increase in frequency of heavy events in mid- and high latitudes of the NH” • “in regions where total precipitation has increased ... even more pronounced increases in heavy precipitation events”
upper 10-ptile 1961-1990 the year 1996 lower 10-ptile 1961-1990
“cold nights” upper 10-ptile 1961-1990 the year 1996 lower 10-ptile 1961-1990
“warm nights” “cold nights” upper 10-ptile 1961-1990 the year 1996 lower 10-ptile 1961-1990
European temperature trends • Recent trends (1946-1999) in temperature extremes reflect the general warming: fewer cold extremes, more warm extremes • Averaged over all stations, the first decades of slight cooling saw narrowing of temperature distributions, whereas the last decades of strong warming saw widening of temperature distributions • IPCC-TAR: • “lengthening of the freeze-free season in most mid- and high latitude regions” • “reduction in frequency of extreme low monthly and seasonal average temperatures and smaller increase in frequency of extreme high average temperatures”