Download
1 / 1
10 likes | 109 Views
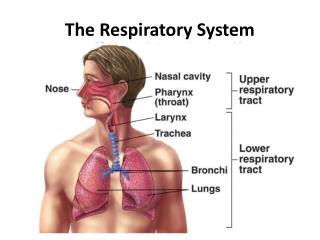
Automated Measurement of Carbon Dioxide Fluxes At Imnaviat Creek, Alaska: Winter of 2007-08 Glenn J. Scott 1 , Dr.Syndonia Bret-Harte 2 , Dr.Gaius Shaver 3 , Dr.Eugenie Euskirchen 4 Institute of Arctic Biology and Marine Biological Laboratory. 1 Research Technician,

E N D
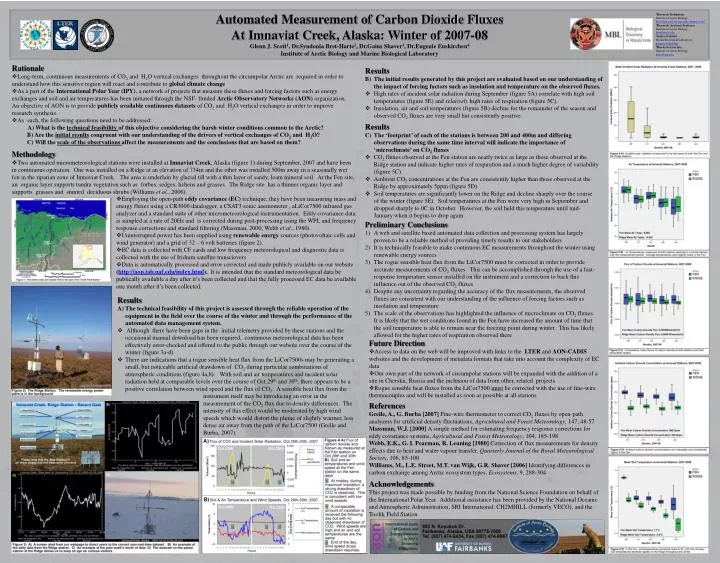
Automated Measurement of Carbon Dioxide Fluxes At Imnaviat Creek, Alaska: Winter of 2007-08 Glenn J. Scott1, Dr.Syndonia Bret-Harte2, Dr.GaiusShaver3, Dr.EugenieEuskirchen4 Institute of Arctic Biology and Marine Biological Laboratory 1Research Technician, Institute of Arctic Biology http://mercury.bio.uaf.edu/~glenn_scott/ 2Research Assistant Professor Institute or Arctic Biology ffmsb@uaf.edu 3Senior Scientist Marine Biological Laboratory gshaver@mbl.edu 4Research Associate, Institute of Arctic Biology, ffese@uaf.edu • Rationale • Long-term, continuous measurements of CO2 and H2O vertical exchanges throughout the circumpolar Arctic are required in order to understand how this sensitive region will react and contribute to global climate change • As a part of the International Polar Year (IPY), a network of projects that measure these fluxes and forcing factors such as energy exchanges and soil and air temperatures has been initiated through the NSF- fundedArctic Observatory Networks (AON) organization. An objective of AON is to provide publicly available continuous datasets of CO2 and H2O vertical exchanges in order to improve research synthesis. • As such, the following questions need to be addressed: • A) What is the technical feasibility of this objective considering the harsh winter conditions common to the Arctic? • B) Are the initial results congruent with our understanding of the drivers of vertical exchanges of CO2 and H2O? • C) Will the scale of the observations affect the measurements and the conclusions that are based on them? • Results • The initial results generated by this project are evaluated based on our understanding of the impact of forcing factors such as insolation and temperature on the observed fluxes. • High rates of incident solar radiation during September (figure 5A) correlate with high soil temperatures (figure 5E) and relatively high rates of respiration (figure 5C). • Insolation, air and soil temperatures (figure 5B) decline for the remainder of the season and observed CO2 fluxes are very small but consistently positive. • Results • The ‘footprint’ of each of the stations is between 200 and 400m and differing observations during the same time interval will indicate the importance of ‘microclimate’ on CO2 fluxes • CO2 fluxes observed at the Fen station are nearly twice as large as those observed at the Ridge station and indicate higher rates of respiration and a much higher degree of variability (figure 5C). • Ambient CO2 concentrations at the Fen are consistently higher than those observed at the Ridge by approximately 5ppm (figure 5D). • Soil temperatures are significantly lower on the Ridge and decline sharply over the course of the winter (figure 5E). Soil temperatures at the Fen were very high in September and dropped sharply to 0C in October. However, the soil held this temperature until mid-January when it begins to drop again. • Methodology • Two automated micrometeorological stations were installed at Imnaviat Creek, Alaska (figure 1) during September, 2007 and have been in continuous operation. One was installed on a Ridge at an elevation of 734m and the other was installed 500m away in a seasonally wet fen in the riparian zone of Imnaviat Creek. The area is underlain by glacial till with a thin layer of sandy, loam mineral soil. At the Fen site, an organic layer supports tundra vegetation such as forbes, sedges, lichens and grasses. The Ridge site has a thinner organic layer and supports grasses and stunted deciduous shrubs (Williams et al., 2006). • Employing the open-path eddy covariance (EC) technique, they have been measuring mass and energy fluxes using a CR3000 datalogger, a CSAT3 sonic anemometer , aLiCor7500 infrared gas analyzer and a standard suite of other micrometeorological instrumentation. Eddy covariance data is sampled at a rate of 20Hz and is corrected during post-processing using the WPL and frequency response corrections and standard filtering (Massman, 2000; Webb et al., 1980). • Uninterrupted power has been supplied using renewable energy sources (photovoltaic cells and wind generator) and a grid of 32 – 6 volt batteries (figure 2). • EC data is collected with CF cards and low frequency meteorological and diagnostic data is collected with the use of Iridium satellite transcievers • Data is automatically processed and error corrected and made publicly available on our website (http://aon.iab.uaf.edu/index.html). It is intended that the standard meteorological data be publically available a day after it’s been collected and that the fully processed EC data be available one month after it’s been collected. Preliminary Conclusions A web and satellite based automated data collection and processing system has largely proven to be a reliable method of providing timely results to our stakeholders It is technically feasible to make continuous EC measurements throughout the winter using renewable energy sources The rogue sensible heat flux from the LiCor7500 must be corrected in order to provide accurate measurements of CO2 fluxes. This can be accomplished through the use of a fast-response temperature sensor installed on the instrument and a correction to back this influence out of the observed CO2 fluxes Despite any uncertainty regarding the accuracy of the flux measurements, the observed fluxes are consistent with our understanding of the influence of forcing factors such as insolation and temperature The scale of the observations has highlighted the influence of microclimate on CO2 fluxes. It is likely that the wet conditions found in the Fen have increased the amount of time that the soil temperature is able to remain near the freezing point during winter. This has likely allowed for the higher rates of respiration observed there • Results • The technical feasibility of this project is assessed through the reliable operation of the equipment in the field over the course of the winter and through the performance of the automated data management system. • Although there have been gaps in the initial telemetry provided by these stations and the occasional manual download has been required, continuous meteorological data has been effectively error-checked and offered to the public through our website over the course of the winter (figure 3a-d). • There are indications that a rogue sensible heat flux from the LiCor7500s may be generating a small, but noticeable artificial drawdown of CO2 during particular combinations of atmospheric conditions (figure 4a,b). With soil and air temperatures and incident solar radiation held at comparable levels over the course of Oct.29th and 30th, there appears to be a positive correlation between wind speed and the flux of CO2. A sensible heat flux from the instrument itself may be introducing an error in the measurement of the CO2 flux due to density differences. The intensity of this effect would be moderated by high wind speeds which would distort the plume of slightly warmer, less dense air away from the path of the LiCor7500 (Grelle and Burba, 2007). • Future Direction • Access to data on the web will be improved with links to the LTER and AON-CADIS websites and the development of metadata formats that take into account the complexity of EC data • Our own part of the network of circumpolar stations will be expanded with the addition of a site in Cherskii, Russia and the inclusion of data from other, related projects • Rogue sensible heat fluxes from the LiCor7500 must be corrected with the use of fine-wire thermocouples and will be installed as soon as possible at all stations References Grelle, A., G. Burba [2007] Fine-wire thermometer to correct CO2 fluxes by open-path analyzers for artificial density fluctuations, Agricultural and Forest Meteorology, 147, 48-57 Massman, W.J. [2000] A simple method for estimating frequency response corrections for eddy covariance systems, Agricultural and Forest Meteorology,104, 185-198 Webb, E.K., G. I. Pearman, R. Leuning [1980] Correction of flux measurements for density effects due to heat and water vapour transfer, Quarterly Journal of the Royal Meteorological Society, 106, 85-100 Williams, M., L.E. Street, M.T. van Wijk, G.R. Shaver [2006] Identifying differences in carbon exchange among Arctic ecosystem types, Ecosystems, 9, 288-304 Acknowledgements This project was made possible by funding from the National Science Foundation on behalf of the International Polar Year. Additional assistance has been provided by the National Oceanic and Atmospheric Administration, SRI International, CH2MHILL (formerly VECO), and the Toolik Field Station.