Download
1 / 27
270 likes | 382 Views
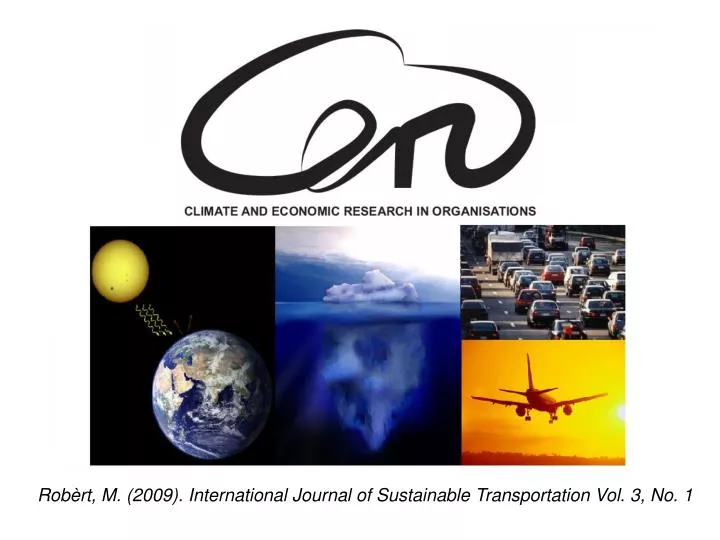
Robèrt, M. (2009). International Journal of Sustainable Transportation Vol. 3, No. 1. What is CERO?. Developed for an energy sector with large complexity: a) travel behaviour needs to be modelled explicitly to get a bottom-up perspective of key players

E N D
Robèrt, M. (2009). International Journal of Sustainable Transportation Vol. 3, No. 1
What is CERO? Developed for an energy sector with large complexity: a) travel behaviour needs to be modelled explicitly to get a bottom-up perspective of key players b) need for tailor-made cost-benefit assessments of alternative travel policies c) Applicable for benchmarking to spread good examples Engages a broad range of experts and researchers: Statisticians Economists Behaviourists Travel managers Technical implementers Developed in a doctoral thesis at KTH:”Mobility Management and Climate Change Policies”
Macro economic effects from 10% traffic reductions in Stockholm county(Robèrt och Jonsson, 2006) -750 MSEK accident costs -360 MSEK emission costs -570 MSEK in vehicle time costs ( = 1,68 Billion SEK/year)
Large organizations are important actors Decision-makers Individuals • Can facilitate market-oriented traffic planning • Can utilize positive ”group mentality” • Motivated to spread good examples
Travel costs and emissions walk hand i hand - Short-term cost cut potential: 200 000-500 000 Euro/1000 employees and year
- “Indirect values” of showing best practice IT-sector, energy sector, transport sector, public authorities…
CERO is based on backcasting Mapping Travel policies Target
Why backcasting? • If we know the target, why not use it? • Avoid “path-dependency”, focusing on current obstacles and constraints • We might well approach a paradigmatic shift where traditional forecasting is insufficient
Target description “X% CO2 reductions in consistency with travel cost reductions and employee acceptance”
Problem with climate targets: % - reductions are appropriate for emission audits but hard to follow-up in policy terms %CO2
Why transforming the emission target? • Facilitates efficiency rankings, cost-benefit analyses and follow-ups between alternative policies • Reduces the level of “fuzziness” regarding potential emission impacts • Helps strategic planning by keeping track on factors that might change over time (u1, u2, N, s, Y…)
Modules of tailor made 1% CO2-reductions(commute trips) • 31 car commuters switch to public transport • Train tickets to 4 commuters with longest commute distance • Encourage 38 car commuters to renewable fuel cars • Allow telecommuting at least once a month • Offer eco-driving to at least ¼ of staff • Encourage at least 191 car commuters with commute distance 0,5-6km to cycle
Modules of tailor made 1% CO2-reductions(business trips) • Replace 7% of business trips by car to public transport Annual cost reduction 1,1 Mkr • Replace 4% of business trips by car to virtual meetings Annual cost reduction 2,3 Mkr • Replace all business trips with private car to car sharing Costs unchanged • Replace 2% of aviation trips abroad to virtual meetings Cost reduction 540.000 kr • Replace 3% av domestic aviation to train Cost reduction215.000 kr
Climate compensation as a last step… Energy use Renewable energy use Climate compensations Year + Could increase profitability from emission reductions - Could pacify good local initiatives and ideas
To sum up:- Make climate travel targets tangible- Identify economically optimized strategies- Emphasize employee benefits- Apply benchmarking to spread ”best practice”