Download
1 / 20
200 likes | 365 Views
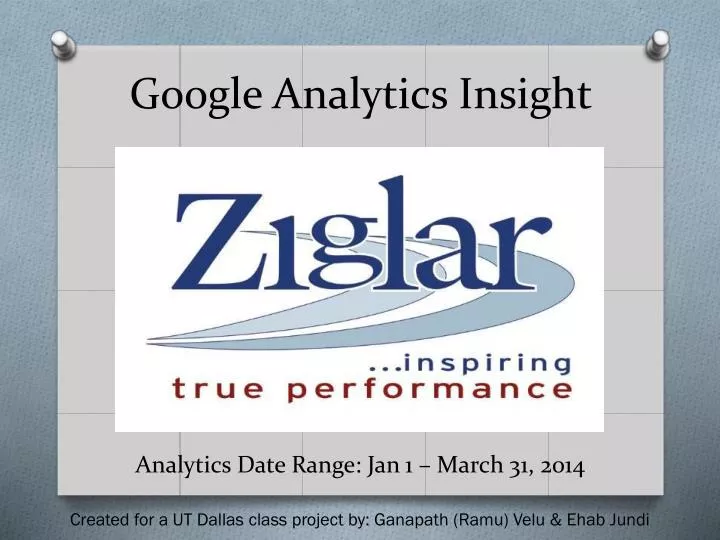
Google Analytics Insight. Analytics Date Range: Jan 1 – March 31, 2014. Created for a UT Dallas class project by: Ganapath (Ramu) Velu & Ehab Jundi.

E N D
Google Analytics Insight Analytics Date Range: Jan 1 – March 31, 2014 Created for a UT Dallas class project by: Ganapath (Ramu) Velu & EhabJundi
2 minutes is the current average attention span today. If visitors are only spending 2 minutes on Ziglar.com, they are not staying any more or any less than any of the other sites they visit. How can Ziglar Corporation increase the amount of time the average visitor spends on Ziglar.com? Recommendation: Get people to come and read daily or weekly articles directly on Ziglar.com it self. This will also increase the Returning Visitor percentage.
Wednesday, November 28th, 2012 Sessions: 12,499 Wednesday, November 6, 2013 Sessions: 16,287 Historically, these two dates spike up in the sessions number drastically. What happened on these dates and how can Ziglar Corporation duplicate it again? Recommendation: If the events can be identified and duplicated, the traffic to Ziglar.com can be increased. Perhaps this is something to do more than once a year, perhaps at a higher frequency, like once in 6 months, or 3 months, or event once every month. What this will do is keep the Ziglar brand in more people’s mind at a higher frequency.
There are people from almost every country in the world visiting Ziglar.com!
Top 10 Countries that visit Ziglar.com
Out of the top 10 countries that visit Ziglar.com, India, South Africa, and Nigeria are the only countries that spend more than 3 minutes on average on the site
India, not only spends more time on average on Ziglar.com than the website’s average of 2 minutes, but also has the highest percentage of New Sessions (new visitors) AND has the lowest Bounce Rate (leaving right after landing on the site) out of the Top 10 List
What Country should Ziglar Corporation invest the most in next after the US?Recommendation: India seems to have a growing interest in Ziglar, or perhaps the entire industry the Ziglar Corporation is in. Invest more resources in India to target that audience more in order to gain more sales and training opportunities in that market.
Ziglar.com Sessions and Engagement on Different Platforms Fun Fact: The #1 Mobile Device Ziglar.com is being viewed on is the Apple iPhone
Over 38% of Sessions that are occurring, are occurring on a mobile device. In the behavior section, it can be seen that mobile devices have the highest Bounce Rate, lowest Pages per Session, and also the lowest Average Session Duration comparatively to other platforms.
How can Ziglar Corporation engage more mobile users? Recommendation: There are a significant number of mobile visitors, and they are engaged the least in every sense, behaviorally. This is because Ziglar.com is not mobile ready. If Ziglar.com can be made mobile ready, the mobile visitors will be able to better engage with the website and the Ziglar brand.
Traffic Sources to Ziglar.com Direct: 196,118 (52.98%) Organic Search: 86,695 (23.42%) Social: 78,844 (21.30%) Referral: 8,486 (2.29%)
Direct Traffic source means that people who are coming to Ziglar.com remember the website URL and are typing it in directly. Ziglar.com has almost a 53% Direct Traffic source rate, which means that more than half the people who come to the site remember the URL without help! That is amazing!
Organic Search Terms Direct: 196,118 (52.98%) Organic: 86,695 (23.42%) Social: 78,844 (21.30%) Referral: 8,486 (2.29%) All the top search terms of people who are searching on Search Engines are searching with the term “Ziglar” This means that the name recognition is amazing. The people who search and come to your website are looking for it.
Organic Search Terms Direct: 196,118 (52.98%) Organic: 86,695 (23.42%) Social: 78,844 (21.30%) Referral: 8,486 (2.29%) What about the people who are not searching for Ziglar? Recommendation: Invest in Search Engine Optimization beyond just the term “Ziglar.” For example, “Results Coaching” or “Motivating Employees” to also drive other traffic to Ziglar.com
Social Media Referrals Direct: 196,118 (52.98%) Organic: 86,695 (23.42%) Social: 78,844 (21.30%) Referral: 8,486 (2.29%) Facebook is listed 3 times out of the Top 10 Traffic Sources. Out of all traffic, over 21% of all traffic is referral from Social Media. Out of all traffic, over 20% is referral traffic from just Facebook alone. That means that 1 in 5 users that come to Ziglar.com, come from Facebook.
Social Media Referrals Direct: 196,118 (52.98%) Organic: 86,695 (23.42%) Social: 78,844 (21.30%) Referral: 8,486 (2.29%) What does this mean about the Ziglar Facebook Page? Recommendation:Whatever Ziglar Corporation is doing on Facebook, the numbers look amazing. Hence, retain the strategies and practices used on Facebook.
Thank You We thank Ziglar Corporation for the opportunity to serve. Please feel free to reach out to us anytime. Ganapath (Ramu) Velu (972) 754 – 7943 Ganapath.Velu@UTDallas.edu LinkedIn.com/in/GanapathVelu EhabJundi (469) 487 - 5480 ejundi@UTDallas.edu LinkedIn.com/in/ejundi Profesor, Dr. ShawnCarraher, PhD: Shawn.Carraher@UTDallas.edu