Download

1 / 51
510 likes | 606 Views
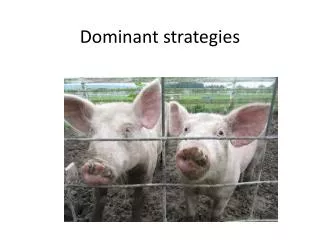
Impact of Dominant Metrics. “Simple can be harder to achieve than keeping it complex. You have to work hard to make it simple. But it’s worth it in the end because once you get there, you can move mountains.”. Objectives. Understand what is “Dominant Information”

E N D
“Simple can be harder to achieve than keeping it complex. You have to work hard to make it simple. But it’s worth it in the end because once you get there, you can move mountains.”
Objectives • Understand what is “Dominant Information” • Understand who should use or who has the most to gain by using “Dominant Information” • Identify an example where Dominant Information could have assisted you
Case Study – ASU Dining Service • 2007, ASU implements the Best-Value process to procure Dining Services • ASU Student Population = 72,000 • $1+ Billion Dining Service contract • 15-Year Contract • Results: • 62% in Revenue • $33 Million
Documenting Success • We will document: • Commissions paid to University • Monthly sales per location • Conference sales • Equipment depreciation schedule • Capital improvement depreciation schedule • Average check per customer • Sales per labor hour • Annual statement of operations • Number and type of meal plan sold • Non-commissionable revenue detail • Mandatory and Voluntary meal plan rate (number and $)
Is This Dominant? • Increase sale of food by 14% • Increased money to ASU by 23% • Decreased management cost by 80% • Increased customer satisfaction by 37%
The difficulty of making things simple can cause us to ignore creating “dominant metrics”
State of Idaho Inmate Health Services • Scope of Work: Provide health services to correctional inmates across Idaho (13 facilities – approximately 5,000 inmates). This includes Healthcare Services, Mental Health Services, and Pharmaceutical Services. • Length of Contract: 3-Year Base Contract (opportunity for 5 total years) • Budget Constraints: $22,900,000 (2010-2011) • RFP Issued: 12/01/2009 • Politics: IDOC extremely dissatisfied with the incumbent
Analysis of Proposals • Awarded Vendor was: • 2.8% below the IDOC’s budget • 9.4% below average of all proposals • Highest Interview • Highest Work Plan • Second highest RAVA Plan
Politics • Client was very disappointed in the best-value process since the highest-prioritized vendor was the incumbent • Client did NOT want to re-hire incumbent • Client not happy with the results • Could not understand why the better vendor did not propose within their budget
Moving Into Phase 2 • The vendor was unaware of clients concerns with their company • They assumed that the client was very satisfied with their past performance. • The client put together a list of their major ‘deal-breakers’ or issues that were causing them significant displeasure in the past. These included: • Incumbents ability to staff the service properly (high turnover issues) • Lack of clear and understandable performance metrics • Incumbents inability to manage the service adequately
Vendor Response: • Very traditional (used vague language / didn’t clearly address the issues) • Individuals preparing the responses did not understand the issues that had occurred in the past with the previous contract. • Did not make the client feel comfortable they could manage the issues. • Could not specifically state what would be done differently • Without understanding the past issues, it is very difficult to explain what they will do differently and how they can improve. • Vendor transfers risks/decision making back to the client (“what exactly would you like us to do” “how would you like us to handle this”)
Client Reaction • The vendor does not understand the new paradigm. Worried about saying the right things to get the contract, instead of figuring out how to succeed. • The client identifies that they have issues about trust, support, and retention • The client identifies that the Regional Manager is a concern. • Staff members will leave if current RM is not replaced • Staff told not to talk to client or they would be fired • RM is creating an adversarial environment
Vendor Reaction • The vendors management dismiss these comments as typical statements that owners make. • Vendor management does not believe that there have been problems in the past • If there were problems, why weren’t they informed previously?
Quick Survey • Perform a third party survey with the client staff • Identify their overall satisfaction with • The vendor • The vendor’s management • The client • Primary Goal: Determine if there is a problem or not! • Within a couple of days, a survey was creased and sent out to all employees. • No names, setup online for a quick response.
Survey Results • Within a week, we received 83 surveys (out of 128) from 9 different facilities • Results confirmed that there was a significant weakness with staff satisfaction towards corporate support and regional manager
Do We Really Have An Issue? • Surveyed 4 other institutions nationwide (similar in size) • Metrics can be used to identify any potential strengths and weaknesses
Summary • Vendors don’t track their critical staff performance • Clients don’t communicate in a ‘dominant’ manner • Dominant metrics can minimize surprises, communication, effort • Dominant metrics can make your operation more efficient
Student Health Insurance Consortium • Create a statewide Student Health Insurance Plan (SHIP) consortium • Boise State University (BSU) • Idaho State University (ISU) • Lewis-Clark State College (LCSC) • 3-Year Contract | $36 Million (for 3-years) • Measurements of Success • Reduce internal University program administration costs • Maintain or increase Customer Satisfaction (University & Students) • Maintain or increase cost-effectiveness of program to students
Coverage/Plan Characteristics • Consortium goal was to standardize coverage between all three University's (to maximum extent possible). However, deviations were made as necessary (BSU athletic coverage, ISU RX Coverage, Capitated Fee, etc) • Consortium goal was to increase plan characteristics (to provide better coverage for students)
Results • Previous Program: • Student Premiums increased $124/year (past 4 years) • Spouse & Dependent Premiums increased $126/year • Best-Value Results: • Student Premium has decreased by 2% (-$26) • Spouse & Dependent Premium has decreased by 19% (-$519) • In general, Benefits/Coverage have been increased • The Best-Value Process was able to stabilize premium rates for the first time in 4 years(for both Student and Spouse/Dependents)
Post Award Metrics • Client is extremely satisfied with award (increased benefits for decreased costs to students) • ASU encourages the vendor to partner: • Perform continuous education with vendor key staff • Collect and analyze student surveys (from SHIP) to document performance • Collect and analyze student surveys (from other programs) • Assist vendor in documenting performance (dominant information) • Assist vendor in documenting the project for long-term success • Vendor states that they are comfortable and does not partner with ASU
Waiver Process • During the first year of the program, the Vendor runs into issues with the waiver process at one of the institutions. • Some students did not meet the minimum requirements (but were allowed to waive out), some were incorrectly denied coverage, and some students have not been notified that they do not meet the standards. • Vendor does not know how to document the issue. ASU proposes the vendor: • Identifies what the issues are and the magnitude of the issue • Identifies why did the issues occur • What is being done to address the issues • What is being done to prevent the issues from reoccurring • Vendor takes several months putting together a summary of the issues. • University is frustrated and request additional audits (added cost to vendor)
Student Surveys • Vendor was required to survey students to identify their satisfaction. • Results of initial student survey showed: • Overall Satisfaction was 4.6 (out of 10) • Number of Responses was 896
Student Surveys • ASU proposes to collect similar survey information from other consortiums to determine if the results are about average with the industry (or above/below). • ASU does a quick analysis of the student surveys and discovers that the dissatisfied students identified issues with claims from the previous vendor. ASU identifies that it would be beneficial to market and educate the students on the differences of this new SHIP program to their previous programs. ASU envisions a simple website that illustrates the differences (prior to completing the survey). • Vendor does not see value in either proposal.
Post Award Metrics • Vendor is unaware of how to provide dominant performance metrics. The Vendor submits a vast amount of data that is confusing to the client (client does not know how to interpret all of the data). • ASU quickly reviews all of the data and prepares a summary: • Based on the loss ratio, student premiums should not increase • University satisfaction increased by 18% • Student satisfaction decreased by 2%
The State of Hawaii • The State of Hawaii-Public Works Division (PWD) received numerous complaints on the quality of completed construction projects. • Roofs were poorly constructed. • Contractors were slow in correcting punch list items. • Response time to warranty work was slow. • Painting work was so bad that the State assumed all painting work on Oahu with their own staff (painting awards dropped from 101 projects to 5 in 1998). • In 1998, PWD implemented the BV process on roofing and painting projects. • Over a 4 year implementation, PWD procured 193 projects using BV (106 roofing, 33 painting, 15 mechanical, 5 electrical, and 34 general renovation projects)
Kapuaiwa Courthouse RenovationCase Study • Historical renovation project • 60 year old, 3 story, 20,000 SF facility • One year design
Kapuaiwa Courthouse RenovationCase Study • Nobody bid the job (design wouldn’t work) • Project was re-bid using PIPS • No specification • Requirement was to waterproof the building for the longest possible period of time • Budget was $800K • Award was made using the PIPS process
Complaints • A small handful of vendors were complaining. • Contacted the media and 19 articles were published stating: • Process was not open (awarding to the same contractors) • Process was unfair • Process was not working • Process was wasting taxpayer money • Projects took longer to complete • Process violated State Regulations
Audit Report • In response to the negative articles, the State performed an audit in November 2002 on the BV process. • The audit analyzed low-bid projects and PIPS projects. • Results/Findings • PIPS resulted in 3% savings of project costs • PIPS resulted in greater contractor accountability • PIPS resulted in fewer Change Orders • PIPS has given higher quality construction
PIPS Roofing Conclusions(Taken from Audit Report, 2002) • Total number of awarded PIPS roofs: 96 • 100% would rather use the PIPS process over low-bid process (55 DOE users) • 100% would use a PIPS contractor again (55 DOE users) • PIPS average performance rating 9.6 (10 max) • Projects were 6% under budget (adjusting for insulation) • Projects finished approximately 35% faster (than LB) • Performance rating of PIPS vs. LB: 8.1 vs. 5.6 • 98% were completed on time • Contractors were almost twice as productive ($4.5K/day vs. $2.5K/day) • In last 4 years, there has been no roof leaks
Outstanding Results…. …But PWD is Directed to go back to Low-Bid
Dominant Metrics • By the time the State had compiled and presented the information, the decision was already made to go back to low-bid. • Although the performance metrics were significantly higher, the Dominant Metrics were not available fast enough. • Decision was based on politics, not performance.