Download
1 / 33
330 likes | 475 Views
Economy and Infrastructure. Socio-economic Status Infrastructure Facility Data based on Census 1991. Socio-Economic Status of the Area. Total population - 4,07,504 Total Rural population - 2,75,783 (67.8%) Total Urban population - 1,19,591 (29.4%)

E N D
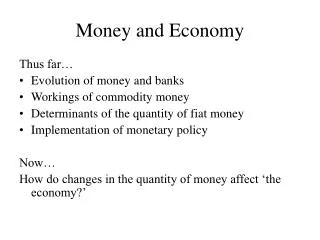
Economy and Infrastructure • Socio-economic Status • Infrastructure Facility • Data based on Census 1991
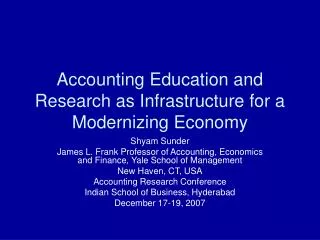
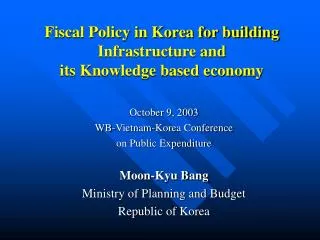
Socio-Economic Status of the Area • Total population - 4,07,504 • Total Rural population - 2,75,783 (67.8%) • Total Urban population - 1,19,591 (29.4%) • Total Forest Village Pop - 12,130 (2%)
B B a a n n k k h h e e d d i i B B a a b b a a i i H H o o s s h h a a n n g g a a b b a a d d P P i i p p a a r r i i y y a a T T a a m m i i a a S S h h o o h h a a g g p p u u r r K K e e s s l l a a J J a a m m a a i i G G h h o o r r a a d d o o n n g g r r i i S S h h a a h h p p u u r r R o a d S a n c t u a r y B o u n d a r y R a i l U r b a n & R u r a l P o p u l a t i o n U r b a n _ p o p u R u r a l _ p o p u
B a n k h e d i B a b a i H o s h a n g a b a d P i p a r i y a S a n c t u a r y B o u n d a r y R a i l R o a d D e n s i t y T a m i a S o h a g p u r 5 4 5 5 - 1 4 5 1 4 6 - 1 9 0 1 9 1 - 2 1 5 K e s l a 2 1 6 - 2 3 0 J a m a i G h o r a D o n g r i S h a h p u r
B a n k h e d i B a b a i H o s h a n g a b a d P i p a r i y a S a n c t u a r y B o u n d a r y R a i l R o a d T a m i a % o f F o r e s t P o p u l a t i o n S h o h a g p u r 0 1 - 2 3 - 8 9 - 1 3 K e s l a J a m a i G h o r a d o n g r i S h a h p u r
SC and ST Population Structure • Total SC Population- 14.7% • Total ST Population- 31.5% • All India % of SC Population- 16.3% • All India % of ST Population- 8%
B a n k h e d i B a b a i H o s h a n g a b a d P i p a r i a S a n c t u a r y B o u n d a r y R o a d R a i l % A G E O F S T T a m a i S h o h a g p u r 7 - 1 2 1 3 - 2 7 2 8 - 3 6 3 7 - 4 6 K e s l a 4 7 - 7 3 J a m a i G h o r a d o n g r i S h a h p u r
Sex Ratio • Sex Ratio- 911 • Lowest Sex Ratio- 861 (Hoshangabad Block) • Highest Sex Ratio- 965 (Tamia) • Sex Ratio (Rural Area)- 924 • Sex Ratio (Urban Area)-880 • Sex Ratio (Forest Villages)- 927 • State average(Sex Ratio)- 912 • All India average (Sex Ratio)-929
Literacy Structure • Total literacy rate- 37.2% • Total male literacy- 47.335 • Total Female literacy- 26% • All India Literacy rate- 52.11%
B a n k h e d i B a b a i H o s h a n g a b a d P i p a r i y a S a n c t u a r y B o u n d a r y R o a d R a i l L i t e r a c y R a t e T a m i a 2 5 S o h a g p u r 2 6 - 3 2 3 3 - 3 5 3 6 - 4 4 K e s l a 4 5 - 4 9 J a m a i G h o r a D o n g r i S h a h p u r
Occupational Structure & Employment Scenario • Workers in Primary Sectors- 69.5% • Workers in Secondary Sectors-8.8% • Workers in tertiary Sector- 21.7% • Total Main Workers- 33% • Total Non Workers- 62.8% • Total marginal Workers- 4%
B a n k h e d i B a b a i H o s h a n g a b a d P i p a r i a S a n c t u a r y B o u n d a r y R a i l T a m i a R o a d % a g e o f W o r k e r s i n F o r e s t B a s e d A c t i v i t i e s S h o h a g p u r 1 - 3 4 - 7 8 - 1 1 K e s l a J a m a i G h o r a d o n g r i S h a h p u r
B a n k h e d i B a b a i H o s h a n g a b a d P i p a r i a S a n c t u a r y B o u n d a r y R o a d T a m i a R a i l S h o h a g p u r % a g e o f P r i m a r y S e c t o r W o r k e r s 4 4 . 2 7 4 4 . 2 7 - 6 9 . 9 5 6 9 . 9 5 - 8 2 . 1 6 8 2 . 1 6 - 9 1 . 5 9 K e s l a J a m a i G h o r a d o n g r i S h a h p u r
B a n k h e d i B a b a i H o s h a n g a b a d P i p a r i a S a n c t u a r y B o u n d a r y T a m i a R o a d S h o h a g p u r R a i l % a g e o f S e c o n d a r y S e c t o r W o r k e r s 1 . 2 5 - 1 . 6 8 1 . 6 8 - 8 . 5 8 8 . 5 8 - 1 0 . 7 2 1 0 . 7 2 - 1 2 . 6 4 K e s l a J a m a i G h o r a d o n g r i S h a h p u r
B a n k h e d i B a b a i H o s h a n g a b a d P i p a r i a T a m i a S h o h a g p u r K e s l a J a m a i G h o r a d o n g r i S h a h p u r S a n c t u a r y B o u n d a r y R o a d R a i l % a g e o f T e r t i a r y S e c t o r w o r k e r s 6 . 7 2 - 1 0 . 8 4 1 0 . 8 4 - 1 3 . 8 3 1 3 . 8 3 - 2 3 . 4 3 2 3 . 4 3 - 4 3 . 0 9
Sectors of Economy • Agriculture • Animal husbandry • Horticulture • Sericulture • Apiculture • Industrial Development • Mines & Minerals • Tourism
Agriculture • Jhum Cultivation- Rori ghat of H’bad and Almod, Patalkot area of Chhindwara • Double Crop Area- Narmada Belt , Tamiya, Jamai and Shahpur blocks • Single Crop- Only Kharif crops. Betul and western and eastern parts of Tawa reservoir • Traditional Crops- Mainly on agriculture land falling in forest area • Vegetables- Northern parts of BR along the SH
Irrigation • Total Irrigated land- 26% of total Cultivated land • Northern part in irrigated by Tawa Command Area • Conjunctive irrigation in Southern parts of BR • Major Irrigation Project- Tawa
Horticulture - Mainly in Tawa command area • Sericulture - Pachmarhi area • Apiculture - Pachmarhi plateau and Patalkot area • Industrial Development- Small scale agriculture based industries around Pipariya • Mines & Minerals- • Sand mining in river beds • Some building Stone mines in Tamiya block • Coal mines in area around Jamai,Damua
Tourism (2000-2001) • Total tourist flow-3,57,321 • Domestic Tourist- 3,57,000 • Foreign Tourist- 321 • Maximum Tourist inflow- May (18.07 %) • Main Tourist inflow months- May, June, October & December
Transport • Backward linkages is very poor • More then 85% roads are villages road • NH-69 connecting State capital of Bhopal with other centers • Majority of block headquarters are connected by NH or SH • Poorest road density is there in the block s of Tamia, Jamai, Betul and Pipariya • Northern and Western parts of BR are well connected by railway • Itersi- Jablapur railway line is passing in Northern boundary of BR • Itersi- Nagpur railway line is passing in Western part of BR • BR area is not connected by Airways. Only an Airstrip is present on Pachmarhi Plateau
Education • Total Primary Schools - 426 (68% villages) • Total Middle Schools - 73 (10.7% villages) • Total High School - 6 (1.1% villages) • Pre University Colleges - 9 (1% villages) • Adult Colleges - 1 (0.2% villages) • Higher Education- There is no degree college in the BR area. Degree colleges are located in tehsils/ blocks headquarters
Health • Primary Health Services -15 (2.8% villages) • Public Health Center - 6 (1.1% villages) • Hospital - 6 (1.1% villages) • Registered Private center -11 (2.0% villages) • Community Health Workers- 3 (0.6% villages) • Dispensary -7 (1.3% villages) • Family Planning Center - 2 (0.4% villages)
Electricity & Drinking Water • Only 21 Villages (about 3% ) yet to be electrified • In the rural area only Dug well and Hand Pump are the major sources for drinking water supply • Remote areas, people are depend only the Springs and Jhiria for drinking water
Communication & Market • Post Offices - 47 (8.8% Villages) • Telegraph Office - 6 (1.1% Villages) • Post/ Tele & Phones- 5 (0.9% Villages) • Markets - 25 (4.3 % Villages)
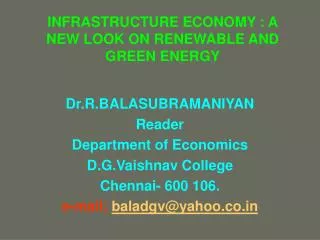
Observations • Overall share of Rural population is more in PBR • Pipariya and Jamai blocks have higher share of population in urban area • Forest Village population percentage is maximum in Ghoradongari block • Rural population density is lowest in Tamiya and Pipariya due to hilly terrain and vegetative cover • Sex ratio is poor in PBR indicates low status of women • in few blocks the high percentage of work force involved in primary sector, indicate over dependence • Employment Scenario is not good as non workers are quite high and participation of females in the working force is low
Observations • The Northern portion of BR is relatively more developed • The forest based activities are maximum in Sohagpur and Pipariya blocks • Agriculture is the mainstay of the PBR,net agriculture land - 26% • Whole Narmad belt is Double crop area • Cereals occupied 71% and non food crops 5.2% of total crop area • Productivity of crops is highest in Hoshangabad district • Concentration of Agriculture markets follows mainly the major corridors • Pisciculture is the most important sector after agriculture in rural area • The availability of milk, meat and egg is far below the actual requirement
Observation • Total horticulture crops/ Fruits crops is about 2% of total land • There is no any industry in PBR • Inspite of good potentiality, Pachmarhi has been receiving very less foreign tourist • The settlement pattern of the BR is scattered and settlement size in the hill areas is very small. • Most of the urban settlements are on the northern side of the BR mainly along the state highway and the national highway. The southern side is devoid of any big urban settlement. • Lopsided settlement development is seen across the BR. • The PBR is dominated by small size settlements. Almost 7% of habitations in BR have less than 100 population and about 58% population lives in a settlement size of 100-500 populations.
Observation • The major settlements according to the population size are Pipariya, Sohagpur, Jamai and Pachmarhi • Overall the PBR has poor Infrastructure facility • PBR has poor connectivity and accessibility • Maximum villages are connected by Kaccha roads • PBR has poor educational facility • Health facilities are not adequate in PBR\ • Very few villages are provided with safe drinking water • Communication facilities are poor