Download
1 / 14
140 likes | 281 Views
March 3, 2011. Molly McCammon Executive Director Alaska Ocean Observing System www.aoos.org. Regional Ocean Observing Systems and CMSP. Why AOOS?. Regional ocean observing systems have mission to integrate & visualize regional data

E N D
March 3, 2011 Molly McCammon Executive Director Alaska Ocean Observing System www.aoos.org Regional Ocean Observing Systemsand CMSP
Why AOOS? • Regional ocean observing systems have mission to integrate & visualize regional data • Federal and state agencies, research institutes (including UA) are members and serve as board • Work closely with private sector and NGOs • Policy neutral – no position on issue of planning & zoning • Sole purpose is to make ocean data more useful for decision makers and stakeholders
Challenges Limited observations & data Expansive region Extreme weather conditions Presence of seasonal sea ice Endangered & threatened species Climate change Small, dispersed population Rapidly changing conditions How can management plans be flexible? Can we make assumptions based on historical data? How do we represent uncertainty?
Incorporate existing observations& data Wind Speed/direction Locations of research instruments Air Temperature Circulation model output Wave height Atmospheric model output Stream Gauge info Climate change projections Sea surface temperature Weather forecasts Sea Surface color Satellite images Currents
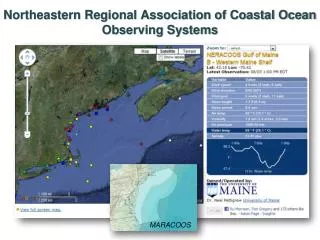
Visualize Real Time Data Real-Time Sensor Map
Visualize Forecasts & Models Model Explorer
Visualize Where the Instruments Are Arctic Research Assets Map: Used for Research planning Reducing duplication of effort Identifying gaps Collision avoidance Opportunities for collaboration Holistic view of research effort
Combining More Data Example layers for future CMSP products Human Use Subsistence Industry activities Roads/transportation corridors Fishing units Political Boundaries Land ownership Conservation areas International waters/EEZ Biological Tagged animal migrations Productivity hotspots Walrus haul outs Oceanographic Bathymetry Ice extent & thickness
Adding Projections & Scenarios Allow users to manipulate layers and save displays Add layers to create new layers IPCC Climate Change scenarios Reduction in sea ice extent Changes in shipping routes Expansion of industry infrastructure & footprint Alteration of wildlife migrations
Assess DST Tools: applicability to Alaska Cumulative Impacts (NCEAS) Marine InVEST ARIES (Conservation International) MIMES (Boston University & New England Aquarium) MarineMap (University of California Santa Barbara) Atlantis (CSIRO) Coastal Resilience (TNC) MARXAN with Zones (University of Queensland) Multipurpose Marine Cadastre (BOEMRE/NOAA) Others……