Download
1 / 32
320 likes | 764 Views
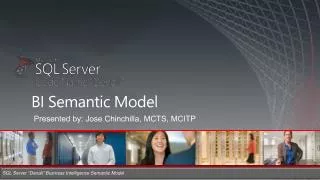
DBI414. Optimizing Your BI Semantic Model for Performance and Scale . Allan Folting, Ashvini Sharma Program Managers SQL Server Business Intelligence Microsoft. Session Objectives. You will understand: architecture of Analysis Services in tabular mode optimizing processing performance

E N D
DBI414 Optimizing Your BI Semantic Model for Performance and Scale Allan Folting, Ashvini Sharma Program Managers SQL Server Business Intelligence Microsoft
Session Objectives • You will understand: • architecture of Analysis Services in tabular mode • optimizing processing performance • query processing architecture
Takeaway • Factors to think through for capacity planning
BI Semantic Model: Architecture Third-party applications Reporting Services SharePoint Insights Excel PowerPivot BI Semantic Model Multi- dimensional Data model Tabular Business logic and queries MDX DAX Direct Query Data access ROLAP VertiPaq MOLAP Databases LOB Applications Files OData Feeds Cloud Services
VertiPaq Design Principles • Performance, Performance, Performance • Query Performance > Processing Performance • Accommodate changes without forcing reload, if possible
VertiPaq Storage T2 (C1,C2) T1 (C1,C2,C3) CC1 CC1 1 2 3 Partition 1 Partition 1 5 4 Partition 2 6 P2 Dictionary Col. Segment Hierarchy Relationship Table data stored in segments & dictionaries per column Partitions are a group of segments and intended for data management 1 5 Calculated columns are stored like regular columns Any table can have partitions, defined independently of other tables. Partitions are only for segment data 2 6 Hierarchies can provide quicker access for querying 3 Relationship structures are created to accelerate lookups across tables, remove hard coupling between tables 4
title Processing Architecture & Optimizations
Processing Phases Segment N Segment N +1 Read & Encode Data Segment N Read & Encode Data Segment N + 1 Build calc cols, hier, relationships t Compress Segment N Compress Segment N+1
Special case of 3rd segment • First segment can “stretch” to be twice as large • Optimizes for smaller lookup tables Segment 1 + 2 Segment 3 Read & Encode Data Segment (until 2*segment_size) Split Read & Encode Data Segment 3 t Compress Segment 3 Compress Segment 1 Compress Segment 2
Processing - Memory & CPU usage Network Split Segment 1 + 2 Segment 3 Memory Read & Encode Data Segment (until 2*segment_size) Read & Encode Data Segment 3 Calc cols, hier, rels. Compress Segment 1 Compress Segment 3 Compress Segment 2 CPU
Controlling Segment Size and Compression • DefaultSegmentRowCount – # of rows in the segment • 0 – default: 8M for Analysis Services, 1M for PowerPivot • Value must be power of 2, should be at least 1M • Larger => generally better compression, faster queries with lower overhead • Smaller => smaller working set during processing • ProcessingTimeboxSecPerMRow • 0 – default: 10 sec • Smaller => greedy algorithm gives most gains in the beginning • Larger => almost always better compression, higher query performance • Increase for large number of columns (~>200) • Reported in profiler & DISCOVER_STORAGE_TABLE_COLUMN_SEGMENTS
Processing options Data T1 • Data CC1 • Recalc • Full: Data and Recalc • Default: Data and Recalc if needed • Defrag: defragment dictionaries for a table • Clear: remove data • Add: creates new partition and merges Hierarchies Relationships
Incremental Processing • Typical • Create new partitions for new data • ProcessData on new partition or to reload into existing tables • Process Recalc to rebuild calc columns, hierarchies, relationships • Avoid • Multiple ProcessFull – each causes a Recalc, unless in a single transactional batch
Advanced Processing • Parallel processing • Use single transaction batch for processing tables in parallel • Parallel processing of a table’s partitions not supported in Denali • Use ProcessDefrag periodically • Deleting partitions may leave outdated values in dictionaries • Merge partitions for reducing metadata overhead • Error handling • RI violations assigned a blank value, no error during processing
Server Memory Map Server memory • VertiPaqPagingMode enables use of system paging • Dictionaries need to remain in memory DB1~ New, not committed part of the database DB1 DB2 FE VertiPaq caches VertiPaqMemoryLimit – 60 % TotalMemoryLimit – 80 %
demo Discover memory used per Database
title Query Processing
Querying Queries • Two formula engines: MDX, DAX • FE calls into VertiPaq to retrieve data • Query logic pushed to VertiPaq where possible • A VertiPaq query executes in parallel, one core per segment • Optimized for execution on compressed format • VertiPaq-level caching for chatty FE/VertiPaq communication • Events in profiler MDX DAX VertiPaq
VertiPaq Query Performance Scans @ 20B+ rows/s 10B+ rows of data Scans @ 5B+ rows/s 1B+ rows of data
Rich & Fast DAX VertiPaq Query • Rich • Single threaded per query • Designed for expressivity • Simple • One core per segment • Optimized for speed More pushed down over time
demo Inspecting Query Evaluation
Best Practices for Tabular Models • Workspace DB for data-driven design experience BI Dev Studio Analysis Services Deploy project DB Analysis Services Workspace DB Process Tables/Partitions
Options for working with large datasets • Point to smaller/empty DB • Filter large tables to reduce rows
Session Objectives and Takeaways • Session Objectives: • Understand the architecture of Analysis Services in tabular mode • Understand and optimize processing performance • Understand query processing architecture • Takeaways: • Factors to think through for capacity planning
Related Content • DBI305: Developing and Managing a BISM DBI61-HOL: Developing a Tabular BISM Using SQL Server Data Tools Microsoft SQL Server: Breakthrough Insights - Credible, Consistent Data
Ashvini.Sharma @microsoft.com @ashvinis Ashvini Sharma
afolting @microsoft.com Allan Folting
Track Resources Hands-On Labs @sqlserver @TechEd_NA #msTechEd SQL Server 2012 Eval Copy Get Certified! mva Microsoft Virtual Academy
Required Slide Complete an evaluation on CommNet and enter to win!
MS Tag Scan the Tag to evaluate this session now on myTechEd Mobile
© 2012 Microsoft Corporation. All rights reserved. Microsoft, Windows, Windows Vista and other product names are or may be registered trademarks and/or trademarks in the U.S. and/or other countries. The information herein is for informational purposes only and represents the current view of Microsoft Corporation as of the date of this presentation. Because Microsoft must respond to changing market conditions, it should not be interpreted to be a commitment on the part of Microsoft, and Microsoft cannot guarantee the accuracy of any information provided after the date of this presentation. MICROSOFT MAKES NO WARRANTIES, EXPRESS, IMPLIED OR STATUTORY, AS TO THE INFORMATION IN THIS PRESENTATION.