Download

1 / 14
140 likes | 221 Views
VaR by example. Zvi Wiener 02-588-3049 http://pluto.mscc.huji.ac.il/~mswiener/zvi.html. Assets. NIS TSAMUD $ Yen Deposit 1yr. 6% 4,000 Bonds 10yr. 5% 2,000 Credit 3yr. 15% 8,000. Liabilities. Today L=6%. NIS TSAMUD $ Yen Saving 2yr. 4% 1,800

E N D
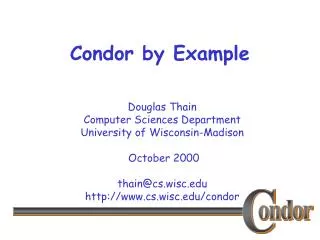
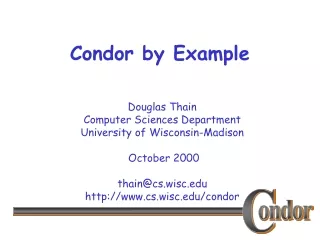
VaR by example Zvi Wiener 02-588-3049 http://pluto.mscc.huji.ac.il/~mswiener/zvi.html
Assets NIS TSAMUD $ Yen Deposit 1yr. 6% 4,000 Bonds 10yr. 5% 2,000 Credit 3yr.15%8,000 Liabilities Today L=6% NIS TSAMUD $ Yen Saving 2yr. 4% 1,800 Deposit 1mo. 11% 8,200 Deposit 3mo. L-2% 3,000 Total: (200) 200 4,000 (3,000) VaR example
Assets NIS TSAMUD $ Yen Deposit 1yr. 6% 4,000 Bonds 10yr. 5% 2,000 Credit 3yr.15%8,000 Liabilities Today L=6% NIS TSAMUD $ Yen Saving 2yr. 4% 1,800 Deposit 1mo. 11% 8,200 Deposit 3mo. L-2% 3,000 Total: (200) 200 4,000 (3,000) VaR example
Risk Factors • USD/NIS exchange rate • Yen/NIS exchange rate • Inflation • Real NIS interest rates (IR, 10 yr., 2 yr.) • Nominal NIS IR (1mo., 10 yr.) • USD IR, (1 yr.) • Yen IR, (Libor 3 mo.) VaR example
Fair Value For risk measurement we need not only the fair value, but the fair value as a function of risk factors in order to estimate the potential profit/loss. VaR example
Fair Value Function VaR example
Fair Value Function VaR example
Fair Value Function VaR example
Biggest market risk Significant risk Significant risk Sensitivity 0.1% 1% 2% 0.5% 0.5% 0.5% 0.5% 0.25% 0.25% -8 40 -60 3 -103 17 -93 -10 2 CPI USD Yen rnominal1mo rnominal3yr rreal2yr rreal10yr rUSD1yr rYen3mo VaR example
Real r 2yr 10 yr T Risky Scenario VaR example
Are not included into BoI requirements Sensitivity 0.1% 1% 2% 0.5% 0.5% 0.5% 0.5% 0.25% 0.25% -8 40 -60 3 -103 17 -93 -10 2 CPI USD Yen rnominal1mo rnominal3yr rreal2yr rreal10yr rUSD1yr rYen3mo VaR example
Gradient Vector Direction of fastest decay (loss). Take the sensitivity vector and divide it by the assumed changes in the risk factors. VaR example
What if ... The sensitivity vector allows to estimate quickly an impact of a certain market move on the value of the portfolio. Scalar multiplication of the gradient vector and the hypothetical market change vector gives the predicted loss/gain. VaR example
Risk Management • Swap Dollar Yen • Two forward contracts • Quanto option • FRA (?) • Fixed - floating swap VaR example