Download
1 / 8
80 likes | 170 Views
How to get top marks for a graph. Here are some typical graphs, some of which contain errors . Can you spot them ?. Simulation of head acceleration during an accident. So what is a graph then ?. Generally , it is a clear visual representation of d ependent

E N D
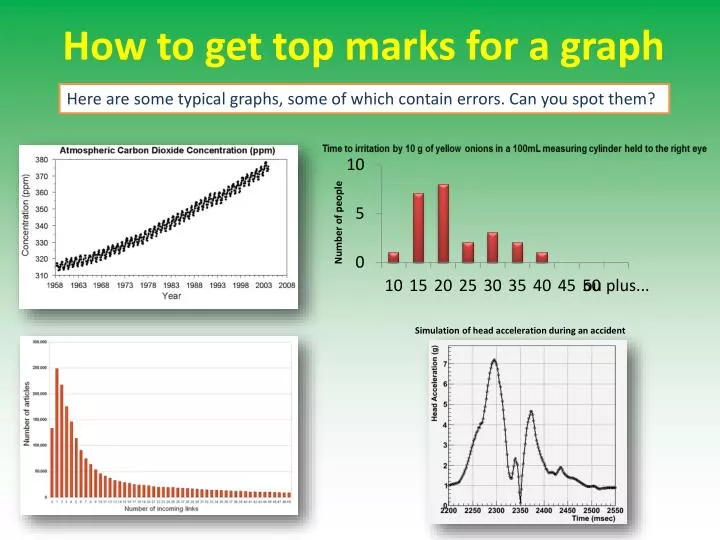
How to get top marks for a graph Here are sometypical graphs, some of whichcontainerrors. Can you spot them? Simulation of headaccelerationduring an accident
So whatis a graph then? Generally, itis a clearvisual representation of dependent vs. independent variable(s) ‘Clear’ means good contrast and scale. Independent variables are onesyou change. Dependentvariables are nature’sreply– the onesyouchoose to observe.
How are my graphs graded? The mostcommon and perhapsmost important graph in science is a two axis graph with a best-fit line. • To score top marks whendoingthese graphs you must include: • A verydetailedtitlewithdependent, independent and even • one or two control variables - the same as for data tables • Labelled x- and y-axes withunits • No joining of dots, but a best-fit line or curve to be able to • seeany trend and to makepredictions
Place the labels and line in the correct place Volume of O2 (cm3) Time (min) Graph of oxygen volume vs. Time for Elodeaat 20°C in direct sunlight
Nowyou know how, open a new page & practice using the following data: Change of absorbance with time for 5 drops of Blackberryjuice in 3mL of 0,1M bleach solution
And one more thing… If you are doing a graph on paper thenbe sure to drawyour data crosses and best-fit line in pencil
To know more about graphingsee: • Mr. Thompson’s You Tube video on Graphing • How to insert a best-fit line • How to plot two y-axes on the same graph • Pencilgraphing, choosing a scale etc.